
Page 285 - Rock Mechanics For Underground Mining
P. 285
STOPE WALL DESIGN – THE MATHEWS STABILITY CHART METHOD
stable under given conditions of rock stress, rock structure and orientation of rock
surfaces, and the shape factor or hydraulic radius, S, which accounts for the geometry
of the stope excavation surface. The stability number is a derivative of Barton’s Q
factor, while the shape factor is identical to the so-called ‘hydraulic radius’ used in
Laubscher’s cavability assessment. The shape factor S is determined from
S = (Stope wall area)/(Stope wall perimeter)
When N and S are plotted on a graph, it is possible to map the complete domain
into zones which represent recorded observations of stability and instability of stope
spans.
The stability number, N, is defined by the product
N = Q xA x B xC (9.37)
In this expression, Q is calculated from the results of structural mapping or geotech-
nical core logging of the rock mass using the method proposed for the tunnelling
quality Q-classification system (Barton et al., 1974), taking the joint water reduction
parameter and the stress reduction factor as unity. The rock stress factor, A, is deter-
mined from the ratio of the intact rock strength (the uniaxial compressive strength,
c ) to the induced compressive stress i , calculated at the centre of the stope wall;
i.e.
c
A = (9.38)
i
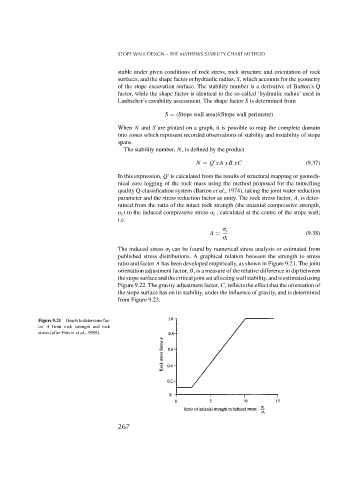
The induced stress i can be found by numerical stress analysis or estimated from
published stress distributions. A graphical relation between the strength to stress
ratio and factor A has been developed empirically, as shown in Figure 9.21. The joint
orientation adjustment factor, B, is a measure of the relative difference in dip between
the stope surface and the critical joint set affecting wall stability, and is estimated using
Figure 9.22. The gravity adjustment factor, C, reflects the effect that the orientation of
the stope surface has on its stability, under the influence of gravity, and is determined
from Figure 9.23.
Figure 9.21 Graph to determine fac-
tor A from rock strength and rock
stress (after Potvin et al., 1989).
267