
Page 88 - Rock Mechanics For Underground Mining
P. 88
ROCK MASS STRUCTURE AND CHARACTERISATION
Figure 3.20 Computerised depic-
tion of two faults intersecting stope
development excavations.
rise to a distribution of orientations for each set rather than the single orientation used
to describe a major feature. Second, their spacings or frequencies are important and
must be represented in some way. As illustrated by Figure 3.7, a histogram of spacing
values is a convenient way of presenting these data. All discontinuities intersected
by a given length of borehole or scanline may be plotted together as in Figure 3.7, or
alternatively, the individual discontinuities may be assigned to particular sets which
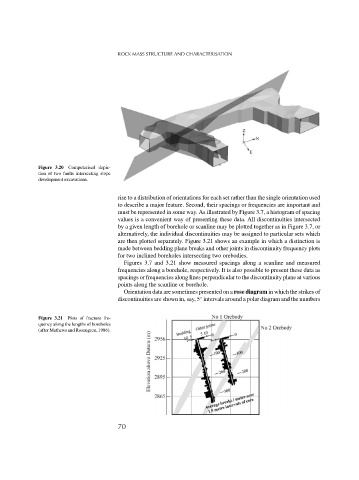
are then plotted separately. Figure 3.21 shows an example in which a distinction is
made between bedding plane breaks and other joints in discontinuity frequency plots
for two inclined boreholes intersecting two orebodies.
Figures 3.7 and 3.21 show measured spacings along a scanline and measured
frequencies along a borehole, respectively. It is also possible to present these data as
spacings or frequencies along lines perpendicular to the discontinuity plane at various
points along the scanline or borehole.
Orientation data are sometimes presented on a rose diagram in which the strikes of
◦
discontinuities are shown in, say, 5 intervals around a polar diagram and the numbers
Figure 3.21 Plots of fracture fre-
quency along the lengths of boreholes
(after Mathews and Rosengren, 1986).
70