
Page 92 - Rock Mechanics For Underground Mining
P. 92
ROCK MASS STRUCTURE AND CHARACTERISATION
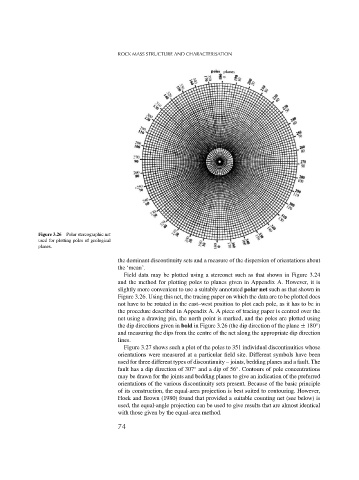
Figure 3.26 Polar stereographic net
used for plotting poles of geological
planes.
the dominant discontinuity sets and a measure of the dispersion of orientations about
the ‘mean’.
Field data may be plotted using a stereonet such as that shown in Figure 3.24
and the method for plotting poles to planes given in Appendix A. However, it is
slightly more convenient to use a suitably annotated polar net such as that shown in
Figure 3.26. Using this net, the tracing paper on which the data are to be plotted does
not have to be rotated in the east–west position to plot each pole, as it has to be in
the procedure described in Appendix A. A piece of tracing paper is centred over the
net using a drawing pin, the north point is marked, and the poles are plotted using
the dip directions given in bold in Figure 3.26 (the dip direction of the plane ± 180 )
◦
and measuring the dips from the centre of the net along the appropriate dip direction
lines.
Figure 3.27 shows such a plot of the poles to 351 individual discontinuities whose
orientations were measured at a particular field site. Different symbols have been
used for three different types of discontinuity – joints, bedding planes and a fault. The
◦
◦
fault has a dip direction of 307 and a dip of 56 . Contours of pole concentrations
may be drawn for the joints and bedding planes to give an indication of the preferred
orientations of the various discontinuity sets present. Because of the basic principle
of its construction, the equal-area projection is best suited to contouring. However,
Hoek and Brown (1980) found that provided a suitable counting net (see below) is
used, the equal-angle projection can be used to give results that are almost identical
with those given by the equal-area method.
74