
Page 94 - Rock Mechanics For Underground Mining
P. 94
ROCK MASS STRUCTURE AND CHARACTERISATION
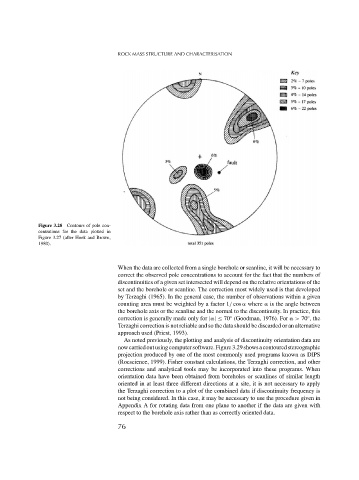
Figure 3.28 Contours of pole con-
centrations for the data plotted in
Figure 3.27 (after Hoek and Brown,
1980).
When the data are collected from a single borehole or scanline, it will be necessary to
correct the observed pole concentrations to account for the fact that the numbers of
discontinuities of a given set intersected will depend on the relative orientations of the
set and the borehole or scanline. The correction most widely used is that developed
by Terzaghi (1965). In the general case, the number of observations within a given
counting area must be weighted by a factor 1/ cos where is the angle between
the borehole axis or the scanline and the normal to the discontinuity. In practice, this
correction is generally made only for | |≤ 70 (Goodman, 1976). For > 70 , the
◦
◦
Terzaghi correction is not reliable and so the data should be discarded or an alternative
approach used (Priest, 1993).
As noted previously, the plotting and analysis of discontinuity orientation data are
nowcarriedoutusingcomputersoftware.Figure3.29showsacontouredstereographic
projection produced by one of the most commonly used programs known as DIPS
(Rocscience, 1999). Fisher constant calculations, the Terzaghi correction, and other
corrections and analytical tools may be incorporated into these programs. When
orientation data have been obtained from boreholes or scanlines of similar length
oriented in at least three different directions at a site, it is not necessary to apply
the Terzaghi correction to a plot of the combined data if discontinuity frequency is
not being considered. In this case, it may be necessary to use the procedure given in
Appendix A for rotating data from one plane to another if the data are given with
respect to the borehole axis rather than as correctly oriented data.
76