
Page 21 - Root Cause Failure Analysis
P. 21
12 Root Cause Failure Analysis
OM13197
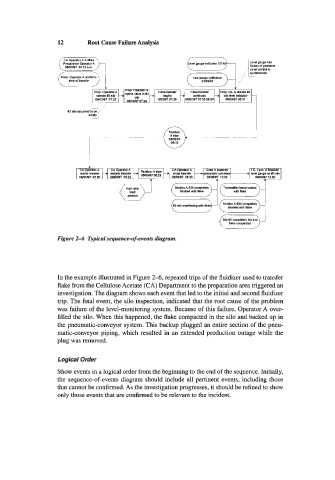
Figure 2-6 Typical sequence-of-events diagram.
In the example illustrated in Figure 2-6, repeated trips of the fluidizer used to transfer
flake from the Cellulose Acetate (CA) Department to the preparation area triggered an
investigation. The diagram shows each event that led to the initial and second fluidizer
trip. The final event, the silo inspection, indicated that the root cause of the problem
was failure of the level-monitoring system. Because of this failure, Operator A over-
filled the silo. When this happened, the flake compacted in the silo and backed up in
the pneumatic-conveyor system. This backup plugged an entire section of the pneu-
matic-conveyor piping, which resulted in an extended production outage while the
plug was removed.
Logical Order
Show events in a logical order from the beginning to the end of the sequence. Initially,
the sequence-of-events diagram should include all pertinent events, including those
that cannot be confirmed. As the investigation progresses, it should be refined to show
only those events that are confirmed to be relevant to the incident.