
Page 19 - Root Cause Failure Analysis
P. 19
10 Root Cause Failure Analysis
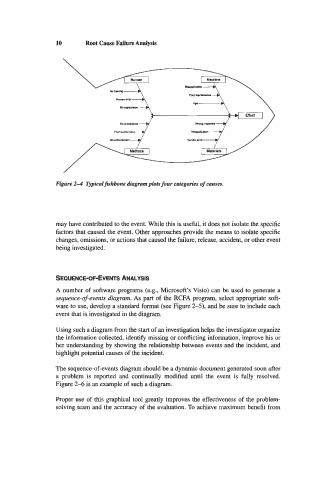
Figure 2-4 ljpicalfishbone diagram plots four categories of causes.
may have contributed to the event. While this is useful, it does not isolate the specific
factors that caused the event. Other approaches provide the means to isolate specific
changes, omissions, or actions that caused the failure, release, accident, or other event
being investigated.
SEQUENCE-OF-EVENTS ANALYSIS
A number of software programs (e.g., Microsoft’s Visio) can be used to generate a
sequence-ofevents diagram. As part of the RCFA program, select appropriate soft-
ware to use, develop a standard format (see Figure 2-5), and be sure to include each
event that is investigated in the diagram.
Using such a diagram from the start of an investigation helps the investigator organize
the information collected, identify missing or conflicting information, improve his or
her understanding by showing the relationship between events and the incident, and
highlight potential causes of the incident.
The sequence-of-events diagram should be a dynamic document generated soon after
a problem is reported and continually modified until the event is fully resolved.
Figure 2-6 is an example of such a diagram.
Proper use of this graphical tool greatly improves the effectiveness of the problem-
solving team and the accuracy of the evaluation. To achieve maximum benefit from