
Page 18 - Root Cause Failure Analysis
P. 18
General Analysis Techniques 9
+ +
,- 7 L
i/ Pnmary Whg Fadwe )t ,/ Pnmry Fuse Failure
'. (Shorhd) \-A' \ (Closed)
--/
~
~~
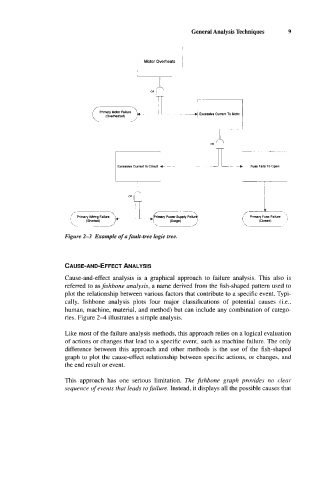
Figure 2-3 Example of a fault-tree logic tree.
CAUSE-AND-EFFECT ANALYSIS
Cause-and-effect analysis is a graphical approach to failure analysis. This also is
referred to as jshbone analysis, a name derived from the fish-shaped pattern used to
plot the relationship between various factors that contribute to a specific event. Typi-
cally, fishbone analysis plots four major classifications of potential causes (i.e..
human, machine, material, and method) but can include any combination of catego-
ries. Figure 24 illustrates a simple analysis.
Like most of the failure analysis methods, this approach relies on a logical evaluation
of actions or changes that lead to a specific event, such as machine failure. The only
difference between this approach and other methods is the use of the fish-shaped
graph to plot the cause-effect relationship between specific actions, or changes, and
the end result or event.
This approach has one serious limitation. The jshbone graph provides no clear
sequence of events that leads to failure. Instead, it displays all the possible causes that