
Page 20 - Root Cause Failure Analysis
P. 20
General Analysis Techniques 11
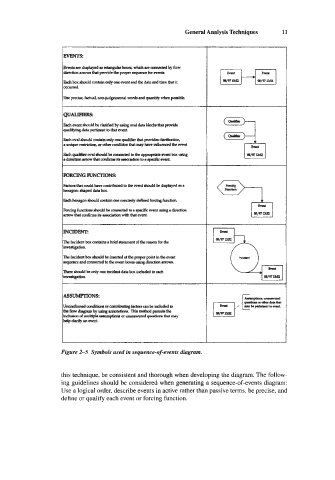
EVENTS:
&enh are diaplnyed as r&ulgdu bmeq whichare axmected by flow
dimdon a- that +e the properaequenxformnts.
M box ahould containonly one event and the date md time Uut it
unured.
Use pmk, haual non-judgemnt.l wd and quantKy when pible.
QUALIFER9
0-l
Each event ahouM becluiAed by using oval dah blacks that pmvide
qdfying data peltknt to uut event
Eachovalaharldcontlinonlyonegualifierthatpmvidescbrihh
a unique restriction. orothereondition that may have inauared the event
Eachqdifierovsl&wldbecmmc&dtotheapprqmi&eventboxusing
adlreetion.mnvtht~itruoeLtion to.sppiflceveIlt.
FORCING FUNCTIONS: w-,
Frtas that cvuld b e mntributed to the event should be displayed as a
haugon- hped data box.
~haugon~dcontninonemmiaelydehedfordng~
Fomhghurtiau.houldbeumnatedtoarpdficmntluingadirectim
umw that confirms its .ssod.k with that event.
INCIDENT:
Thelncidentboxcabriefstatenlentofthereamnforthe
inVestig.tiOn.
The lncidRabox should be inmestd at the pmper pant in the event
qence andamneckd to the evmt boxes using diActim a m .
‘Ihae should be only one wentdatd box mcluded in mch
inveahpw
ASSUMPIIONS:
I
Figure 2-5 Symbols used in sequence-of-events diagram.
this technique, be consistent and thorough when developing the diagram. The follow-
ing guidelines should be considered when generating a sequence-of-events diagram:
Use a logical order, describe events in active rather than passive terms, be precise, and
define or qualify each event or forcing function.