
Page 390 - Sensors and Control Systems in Manufacturing
P. 390
344
Cha p te r
Se v e n
ter
a
i
a
Material B
M
l B
Material B d 0 + δd 0
Material A d 0
Material A
Material A
Material A
Material B
Material B
> α , δd < 0
Temperature coefficient α A B 0
(a) (b)
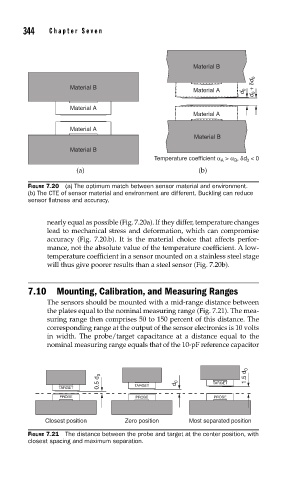
FIGURE 7.20 (a) The optimum match between sensor material and environment.
(b) The CTE of sensor material and environment are different. Buckling can reduce
sensor fl atness and accuracy.
nearly equal as possible (Fig. 7.20a). If they differ, temperature changes
lead to mechanical stress and deformation, which can compromise
accuracy (Fig. 7.20.b). It is the material choice that affects perfor-
mance, not the absolute value of the temperature coefficient. A low-
temperature coefficient in a sensor mounted on a stainless steel stage
will thus give poorer results than a steel sensor (Fig. 7.20b).
7.10 Mounting, Calibration, and Measuring Ranges
The sensors should be mounted with a mid-range distance between
the plates equal to the nominal measuring range (Fig. 7.21). The mea-
suring range then comprises 50 to 150 percent of this distance. The
corresponding range at the output of the sensor electronics is 10 volts
in width. The probe/target capacitance at a distance equal to the
nominal measuring range equals that of the 10-pF reference capacitor
0.5 d 0 d 0 TARGET 1.5 d 0
TARGET TARGET
PROBE PROBE PROBE
Closest position Zero position Most separated position
FIGURE 7.21 The distance between the probe and target at the center position, with
closest spacing and maximum separation.