
Page 244 - Separation process principles 2
P. 244
6.5 Stage Efficiency 209
Table 6.6 Performance Data for Absorption in Laboratory Bubble-Cap Tray Columns
Column Tray Average Average Overall
Diameter, No. of Spacing, Pressure, Temp., Stage
Service in. Trays in. psia OF Efficiency, %
Absorption of 18 1 - 14.7 57 69
ammonia in water
Absorption of 2 1 - 66 78.8 36.4
isobutylene in
heavy naphtha
Absorption of 2 1 66 118.4 13.1
propylene in gas oil
Absorption of 2 1 - 66 105.8 4.7
, propylene in
gas lube oil
Absorption of 18 1 - 14.7 50.4 2.0
carbon dioxide
in water
Desorption of 5 4 11 14.7 77 0.65
carbon dioxide from
43.7 wt% aqueous
glycerol
Source: J.F. Walter and T.K. Sherwood [9].
the molar-average viscosity of the rich oil (liquid leaving an relative importance of liquid-phase and gas-phase mass-
absorber or liquid entering a stripper) at the average tower transfer resistances can shift. Thus, O'Connell [8] found
temperature over a viscosity range of 0.19 to 1.58 cP. The that the Drickamer-Bradford correlation, (6-22), was inade-
empirical equation, quate for absorbers and strippers when applied to species
covering a wide range of volatility or K-values. This addi-
E, = 19.2 - 57.8 log p~, 0.2 < p~ < 1.6 CP (6-22)
tional effect is indicated clearly in the performance data of
where E, is in percent and p is in centipoise, fits the data Tables 6.5 and 6.6, where liquid viscosity alone cannot cor-
with average- and maximum-percent deviations of 10.3% relate the data. O'Connell obtained a more general correla-
and 4 1 %, respectively. A plot of the Drickamer and Bradford tion by using a parameter that included not only the liquid
correlation, compared to performance data, is given in Fig- viscosity but also the liquid density and the Henry's law
ure 6.14. Equation (6-22) should not be used for absorption constant of the species being absorbed or stripped. Edmister
into nonhydrocarbon liquids and is restricted to the listed [lo] and Lockhart and Leggett [ll] suggested slight modifi-
range of the liquid viscosity data used to develop the cations to the O'Connell correlation to permit its use with
correlation. K-values (instead of Henry's-law constants). An O'Connell-
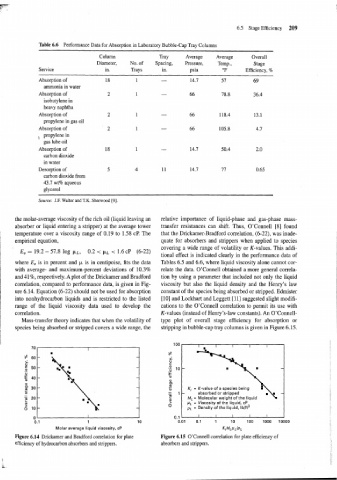
Mass-transfer theory indicates that when the volatility of type plot of overall stage efficiency for absorption or
species being absorbed or stripped covers a wide range, the stripping in bubble-cap tray columns is given in Figure 6.15.
-
ML = Molecular weight of the liquid
pL = Viscosity of the liquid, cP
pL = Density of the liquid, lb/ft3
0 1 I I 0.1 I I I I I
0.1 1 10 0.01 0.1 1 10 100 1000 10000
Molar average liquid viscosity, cP Kt"~~~/~~
Figure 6.14 Drickamer and Bradford correlation for plate Figure 6.15 O'Connell correlation for plate efficiency of
efficiency of hydrocarbon absorbers and strippers. absorbers and strippers.