
Page 245 - Separation process principles 2
P. 245
210 Chapter 6 Absorption and Stripping of Dilute Mixtures
The correlating parameter, suggested by Edmister, is
Ki MLp~/p~, where:
Ki = F-value of species being absorbed or stripped
ML = molecular weight of the liquid, IbAbmol
p~ = viscosity of the liquid, cP
p~ = density of the liquid, lb/ft3
Thus, the correlating parameter has the units of CP-ft3/lbmol.
A reasonable fit to the 33 data points used by O'Connell is
given by the empirical equation
log E, = 1.597 - 0.199 log -
(K:pL)
The average and maximum deviations of (6-23) for the 33 data
points of Figure 6.15 are 16.3% and 157%, respectively.
More than 50% of the data points, including points for the
I highest- and lowest-observed efficiencies, are predicted to unsatisfactory operation
0
I within 10%.
1
The 33 data points in Figure 6.15 cover a wide range of
I conditions: Liquid flow rate, gallrnin
1 Column diameter: 2 in. to 9 ft
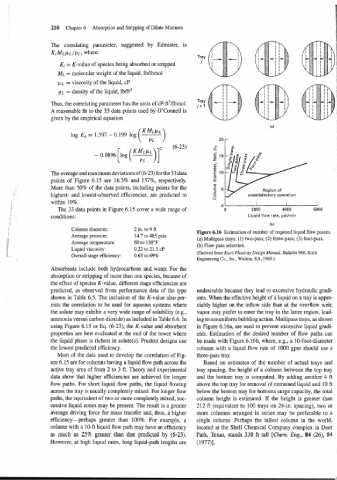
: Figure 6.16 Estimation of number of required liquid flow passes.
Average pressure: 14.7 to 485 psia
(a) Multipass trays: (1) two-pass; (2) three-pass; (3) four-pass.
Average temperature: 60 to 138'F
(b) Flow pass selection.
Liquid viscosity: 0.22 to 21.5 cP
(Derived from Koch Flexitray Design Manual, Bulletin 960, Koch
Overall stage efficiency: 0.65 to 69%
Engineering Co., Inc., Wichita, KA, 1960.)
Absorbents include both hydrocarbons and water. For the
absorption or stripping of more than one species, because of
the effect of species K-value, different stage efficiencies are
predicted, as observed from performance data of the type undesirable because they lead to excessive hydraulic gradi-
shown in Table 6.5. The inclusion of the K-value also per- ents. When the effective height of a liquid on a tray is appre-
mits the correlation to be used for aqueous systems where ciably higher on the inflow side than at the overflow weir,
the solute may exhibit a very wide range of solubility (e.g., vapor may prefer to enter the tray in the latter region, lead-
ammonia versus carbon dioxide) as included in Table 6.6. In ing to nonuniform bubbling action. Multipass trays, as shown
using Figure 6.15 or Eq. (6-23), the K-value and absorbent in Figure 6.16a, are used to prevent excessive liquid gradi-
properties are best evaluated at the end of the tower where ents. Estimation of the desired number of flow paths can
the liquid phase is richest in solute(s). Prudent designs use be made with Figure 6.16b, where, e.g., a 10-foot-diameter
the lowest predicted efficiency. column with a liquid flow rate of 1000 gpm should use a
Most of the data used to develop the correlation of Fig- three-pass tray.
ure 6.15 are for columns having a liquid flow path across the Based on estimates of the number of actual trays and
active tray area of from 2 to 3 ft. Theory and experimental tray spacing, the height of a column between the top tray
data show that higher efficiencies are achieved for longer and the bottom tray is computed. By adding another 4 ft
flow paths. For short liquid flow paths, the liquid flowing above the top tray for removal of entrained liquid and 10 ft
across the tray is usually completely mixed. For longer flow below the bottom tray for bottoms surge capacity, the total
paths, the equivalent of two or more completely mixed, suc- column height is estimated. If the height is greater than
cessive liquid zones may be present. The result is a greater 212 ft (equivalent to 100 trays on 24-in. spacing), two or
average driving force for mass transfer and, thus, a higher more columns arranged in series may be preferable to a
efficiency-perhaps greater than 100%. For example, a single column. Perhaps the tallest column in the world,
column with a 10-ft liquid flow path may have an efficiency located at the Shell Chemical Company complex in Deer
as much as 25% greater than that predicted by (6-23), Park, Texas, stands 338 ft tall [Chem. Eng,, 84 (26), 84
However, at high liquid rates, long liquid-path lengths are (1977)l.