
Page 243 - Separation process principles 2
P. 243
208 Chapter 6 Absorption and Stripping of Dilute Mixtures
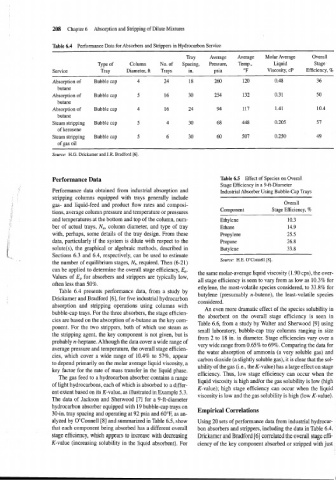
Table 6.4 Performance Data for Absorbers and Strippers in Hydrocarbon Service
--
Tray Average Average Molar Average Overall
Type of Column No. of Spacing, Pressure, Temp., Liquid Stage
Service Tray Diameter, ft Trays in. psia OF Viscosity, cP Efficiency, %
Absorption of Bubble cap 4 24 18 260 120 0.48 36
butane
Absorption of Bubble cap 5 16 30 254 132 0.31 50
butane
Absorption of Bubble cap 4 16 24 94 117 1.41 10.4
butane
Steam stripping Bubble cap 5 4 30 68 448 0.205 57
of kerosene
Steam stripping Bubble cap 5 6 30 60 507 0.250 49
of gas oil
Source: H.G. Drickamer and J.R. Bradford [6].
Performance Data Table 6.5 Effect of Species on Overall
Stage Efficiency in a 9-ft-Diameter
Performance data obtained from industrial absorption and Industrial Absorber Using Bubble-Cap Trays
stripping columns equipped with trays generally include
Overall
gas- and liquid-feed and product flow rates and composi-
Component Stage Efficiency, %
tions, average column pressure and temperature or pressures
-
-
and temperatures at the bottom and top of the column, num- Ethylene 10.3
ber of actual trays, N,, column diameter, and type of tray Ethane 14.9
with, perhaps, some details of the tray design. From these Propy leile 25.5
data, particularly if the system is dilute with respect to the Propane 26.8
solute(s), the graphical or algebraic methods, described in Butylene 33.8
Sections 6.3 and 6.4, respectively, can be used to estimate
Source: H.E. O'Connell[8].
the number of equilibrium stages, N,, required. Then (6-21)
can be applied to determine the overall stage efficiency, E,. the same molar-average liquid viscosity (1.90 cps), the over-
Values of E, for absorbers and strippers are typically low,
all stage efficiency is seen to vary from as low as 10.3% for
often less than 50%.
ethylene, the most-volatile species considered, to 33.8% for
Table 6.4 presents performance data, from a study by
butylene (presumably n-butene), the least-volatile species
Drickamer and Bradford [6], for five industrial hydrocarbon
considered.
absorption and stripping operations using columns with
An even more dramatic effect of the species solubility in
bubble-cap trays. For the three absorbers, the stage efficien-
the absorbent on the overall stage efficiency is seen in
cies are based on the absorption of n-butane as the key com-
Table 6.6, from a study by Walter and Sherwood [9] using
ponent. For the two strippers, both of which use steam as
small laboratory, bubble-cap tray columns ranging in size
the stripping agent, the key component is not given, but is
from 2 to 18 in. in diameter. Stage efficiencies vary over a
probably n-heptane. Although the data cover a wide range of
very wide range from 0.65% to 69%. Comparing the data for
average pressure and temperature, the overall stage efficien-
the water absorption of ammonia (a very soluble gas) and
cies, which cover a wide range of 10.4% to 57%, appear
carbon dioxide (a slightly soluble gas), it is clear that the sol-
to depend primarily on the molar average liquid viscosity, a
ubility of the gas (i.e., the K-value) has a large effect on stage
key factor for the rate of mass transfer in the liquid phase.
efficiency. Thus, low stage efficiency can occur when the
The gas feed to a hydrocarbon absorber contains a range
liquid viscosity is high andlor the gas solubility is low (high
of light hydrocarbons, each of which is absorbed to a differ-
K-value); high stage efficiency can occur when the liquid
ent extent based on its K-value, as illustrated in Example 5.3.
viscosity is low and the gas solubility is high (low K-value).
The data of Jackson and Sherwood [7] for a 9-ft-diameter
hydrocarbon absorber equipped with 19 bubble-cap trays on Empirical Correlations
30-in. tray spacing and operating at 92 psia and 60°F, as an-
alyzed by 0'~onnell[8] and summarized in Table 6.5, show Using 20 sets of performance data from industrial hydrocar-
that each component being absorbed has a different overall bon absorbers and strippers, including the data in Table 6.4,
stage efficiency, which appears to increase with decreasing Drickamer and Bradford [6] correlated the overall stage effi-
K-value (increasing solubility in the liquid absorbent). For ciency of the key component absorbed or stripped with just