
Page 240 - Separation process principles 2
P. 240
6.4 Algebraic Method for Determining the Number of Equilibrium Stages 205
The actual solute-free absorbent rate, at 50% above the minimum Solving for Y, we obtain
rate, is 0.57X
L' = lS(97.5) = 146.2 krnoVh Y=
1 + 0.43X
The amount of transferred from the gas to the liq-
To cover the entire column, the necessary range of X for a plot
uid is 97% of the amount of alcohol in the entering gas or of Y vs X is 0 to almost 0.025. From the Y-X equation, (2),
(0.97)(0.02)(180) = 3.49 kmoVh
Y X
The amount of ethyl alcohol remaining in the exiting gas is 0.00000 0.000
We now compute the alcohol mole ratios at both ends of the
operating line as follows, referring to Figure 6.8a:
top 1x0 = 0,
For this dilute system in ethyl alcohol, the maximum error in Y is
1.0% if Y is taken simply as Y = KX = 0.57X.
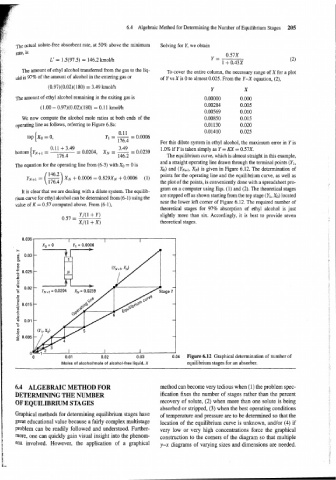
The equilibrium curve, which is almost straight in this example,
and a straight operating line drawn through the terminal points (Y1,
The equation for the operating line from (6-3) with Xo = 0 is
Xo) and (YN+l, XN) is given in Figure 6.12. The determination of
points for the operating line and the equilibrium curve, as well as
the plot of the points, is conveniently done with a spreadsheet pro-
gram on a computer using Eqs. (1) and (2). The theoretical stages
It is clear that we are dealing with a dilute system. The equilib-
are stepped off as shown starting from the top stage (Yl, Xo) located
rium curve for ethyl alcohol can be determined from (6-1) using the
near the lower left comer of Figure 6.12. The required number of
value of K = 0.57 computed above. From (6-l),
theoretical stages for 97% absorption of ethyl alcohol is just
slightly more than six. Accordingly, it is best to provide seven
theoretical stages.
Figure 6.12 Graphical determination of number of
Moles of alcohol/rnole of alcohol-free liquid, X equilibrium stages for an absorber.
6.4 ALGEBRAIC METHOD FOR method can become very tedious when (1) the problem spec-
DETERMINING THE NUMBER ification fixes the number of stages rather than the percent
OF EQUILIBRIUM STAGES recovery of solute, (2) when more than one solute is being
absorbed or stripped, (3) when the best operating conditions
Graphical methods for determining equilibrium stages have of temperature and pressure are to be determined so that the
great educational value because a fairly complex multistage location of the equilibrium curve is unknown, and/or (4) if
problem can be readily followed and understood. Further- very low or very high concentrations force the graphical
more, one can quickly gain visual insight into the phenom- construction to the comers of the diagram so that multiple
ena involved. However, the application of a graphical y-x diagrams of varying sizes and dimensions are needed.