Page 200 - Serious Incident Prevention How to Achieve and Sustain Accident-Free Operations in Your Plant or Company
P. 200

CH15pp159-189  4/10/02  12:51 PM  Page 168
             168
                            Level  x  Weight =  Score
                                        150
                                225
                                              200
                           Calculations
                                        25
                                25
                                              25
                                         6
                                              8
                                9
                                 960
                            Value
                                         88
                                1000
                                        100
                            10
                                950
                                        98
                            9
                                900
                                        95
                            8
                                800
                                        90
                            7
                           Level
                                700
                                        85
                            6
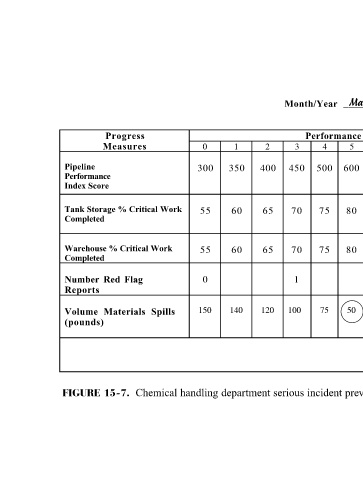
                    March  xx _____________  Serious Incident Prevention 96  100  98  95  90  85  80  100  10  10  3  2  3  3  5  10  25  50  75  15  1  5  45  Monthly Score:  750 12-Month Moving Average:  605  Goal:  >700 Chemical handling department serious incident prevention performance index—alternative matrix.
                                600
                                        80
                            5
                     Month/Year   Performance   4  3  500  450  75  70  75  70  1  75  100
                            2   400     65      65         120
                                350     60      60
                            1                              140
                            0   300     55      55   0     150
                           Progress  Measures  Tank Storage % Critical Work  Warehouse % Critical Work  Number  Red  Flag  Spills Materials
                                Pipeline  Performance  Index Score  Completed  Completed  Reports  Volume   (pounds)  FIGURE 15-7.
   195   196   197   198   199   200   201   202   203   204   205