
Page 202 - Serious Incident Prevention How to Achieve and Sustain Accident-Free Operations in Your Plant or Company
P. 202
CH15pp159-189 4/10/02 12:51 PM Page 169
Applying the Process Model—A Case Study 169
The QMI pipeline team is comprised of the first-level supervisor re-
sponsible for pipeline operations, together with all other personnel respon-
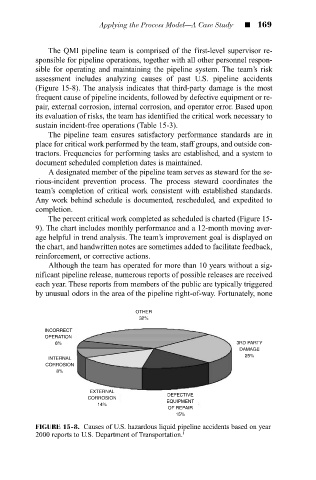
sible for operating and maintaining the pipeline system. The team’s risk
assessment includes analyzing causes of past U.S. pipeline accidents
(Figure 15-8). The analysis indicates that third-party damage is the most
frequent cause of pipeline incidents, followed by defective equipment or re-
pair, external corrosion, internal corrosion, and operator error. Based upon
its evaluation of risks, the team has identified the critical work necessary to
sustain incident-free operations (Table 15-3).
The pipeline team ensures satisfactory performance standards are in
place for critical work performed by the team, staff groups, and outside con-
tractors. Frequencies for performing tasks are established, and a system to
document scheduled completion dates is maintained.
A designated member of the pipeline team serves as steward for the se-
rious-incident prevention process. The process steward coordinates the
team’s completion of critical work consistent with established standards.
Any work behind schedule is documented, rescheduled, and expedited to
completion.
The percent critical work completed as scheduled is charted (Figure 15-
9). The chart includes monthly performance and a 12-month moving aver-
age helpful in trend analysis. The team’s improvement goal is displayed on
the chart, and handwritten notes are sometimes added to facilitate feedback,
reinforcement, or corrective actions.
Although the team has operated for more than 10 years without a sig-
nificant pipeline release, numerous reports of possible releases are received
each year. These reports from members of the public are typically triggered
by unusual odors in the area of the pipeline right-of-way. Fortunately, none
OTHER
32%
INCORRECT
OPERATION
6% 3RD PARTY
DAMAGE
25%
INTERNAL
CORROSION
8%
EXTERNAL
DEFECTIVE
CORROSION
EQUIPMENT
14%
OF REPAIR
15%
FIGURE 15-8. Causes of U.S. hazardous liquid pipeline accidents based on year
2000 reports to U.S. Department of Transportation. 1