Page 207 - Serious Incident Prevention How to Achieve and Sustain Accident-Free Operations in Your Plant or Company
P. 207

CH15pp159-189  4/10/02  12:51 PM  Page 174
             174
                             Level  x  Weight =  Score
                                  280
                                         240
                           Calculations
                                         40
                                 40
                                 7
                                          6
                             Value
                                         91
                                  96
                                         100
                                 100
                             10
                                         98
                                 99
                             9
                                 98
                                         96
                             8
                                 96
                                         95
                             7
                           Level
                                 90
                                         90
                             6
                           Performance
                                         80
                                 85
                             5
                                 80
                                         70
                             4
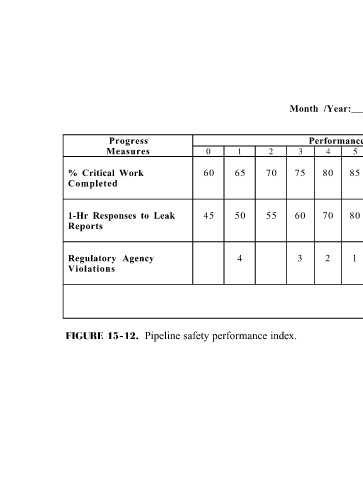
                      Month  /Year:_____/______  xx  3  Serious Incident Prevention 20  0  200  10  0  1  2  3  Monthly  Total:  720 12-Month  Moving  Average:  650  Goal:  Current   >700
                                         60
                                 75
                             3
                                                               Pipeline safety performance index.
                                 70      55
                             2
                                 65      50      4
                             1
                             0   60      45
                           Progress  Measures  1-Hr  Responses  to  Leak  Agency
                                 %  Critical  Work  Completed  Reports  Regulatory   Violations  FIGURE 15-12.
   202   203   204   205   206   207   208   209   210   211   212