
Page 206 - Serious Incident Prevention How to Achieve and Sustain Accident-Free Operations in Your Plant or Company
P. 206
CH15pp159-189 4/10/02 12:51 PM Page 173
Applying the Process Model—A Case Study 173
Percent On-Site Responses Within One Hour
100
90
80
70
60
50
Quarterly
40 Average
30
Goal
20
10
0
1 2 3 4 5 6 7 8 9
Quarter
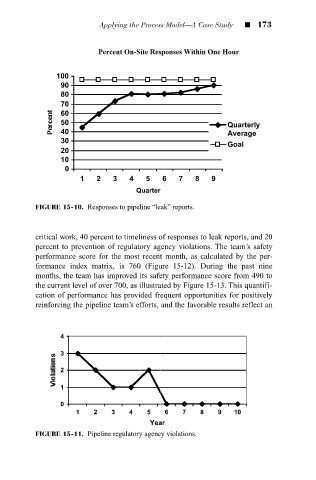
FIGURE 15-10. Responses to pipeline “leak” reports.
critical work, 40 percent to timeliness of responses to leak reports, and 20
percent to prevention of regulatory agency violations. The team’s safety
performance score for the most recent month, as calculated by the per-
formance index matrix, is 760 (Figure 15-12). During the past nine
months, the team has improved its safety performance score from 490 to
the current level of over 700, as illustrated by Figure 15-13. This quantifi-
cation of performance has provided frequent opportunities for positively
reinforcing the pipeline team’s efforts, and the favorable results reflect an
4
3
2
1
0
1 2 3 4 5 6 7 8 9 10
Year
FIGURE 15-11. Pipeline regulatory agency violations.