
Page 93 - Shigley's Mechanical Engineering Design
P. 93
bud29281_ch02_031-070.qxd 11/11/09 09:35 PM Page 68 Debd Hard Disk1:Desktop Folder:Temp Work:Satya 10/11/09:
68 Mechanical Engineering Design
Using the tabulated values of G and E in Table A–5, calculate Poisson’s ratio for steel, aluminum,
beryllium copper, and gray cast iron. Determine the percent difference between the calculated
values and the values tabulated in Table A–5.
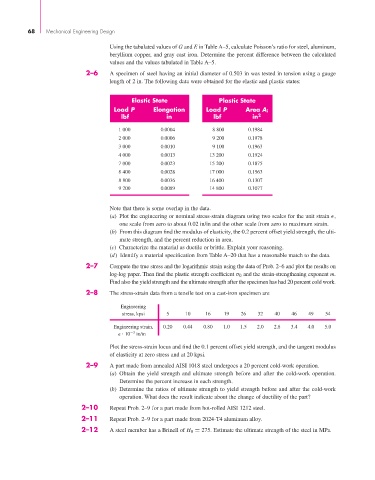
2–6 A specimen of steel having an initial diameter of 0.503 in was tested in tension using a gauge
length of 2 in. The following data were obtained for the elastic and plastic states:
Elastic State Plastic State
Load P Elongation Load P Area A i
lbf in lbf in 2
1 000 0.0004 8 800 0.1984
2 000 0.0006 9 200 0.1978
3 000 0.0010 9 100 0.1963
4 000 0.0013 13 200 0.1924
7 000 0.0023 15 200 0.1875
8 400 0.0028 17 000 0.1563
8 800 0.0036 16 400 0.1307
9 200 0.0089 14 800 0.1077
Note that there is some overlap in the data.
(a) Plot the engineering or nominal stress-strain diagram using two scales for the unit strain ,
one scale from zero to about 0.02 in/in and the other scale from zero to maximum strain.
(b) From this diagram find the modulus of elasticity, the 0.2 percent offset yield strength, the ulti-
mate strength, and the percent reduction in area.
(c) Characterize the material as ductile or brittle. Explain your reasoning.
(d) Identify a material specification from Table A–20 that has a reasonable match to the data.
2–7 Compute the true stress and the logarithmic strain using the data of Prob. 2–6 and plot the results on
log-log paper. Then find the plastic strength coefficient σ 0 and the strain-strengthening exponent m.
Find also the yield strength and the ultimate strength after the specimen has had 20 percent cold work.
2–8 The stress-strain data from a tensile test on a cast-iron specimen are
Engineering
stress, kpsi 5 10 16 19 26 32 40 46 49 54
Engineering strain, 0.20 0.44 0.80 1.0 1.5 2.0 2.8 3.4 4.0 5.0
10 3 in/in
Plot the stress-strain locus and find the 0.1 percent offset yield strength, and the tangent modulus
of elasticity at zero stress and at 20 kpsi.
2–9 A part made from annealed AISI 1018 steel undergoes a 20 percent cold-work operation.
(a) Obtain the yield strength and ultimate strength before and after the cold-work operation.
Determine the percent increase in each strength.
(b) Determine the ratios of ultimate strength to yield strength before and after the cold-work
operation. What does the result indicate about the change of ductility of the part?
2–10 Repeat Prob. 2–9 for a part made from hot-rolled AISI 1212 steel.
2–11 Repeat Prob. 2–9 for a part made from 2024-T4 aluminum alloy.
2–12 A steel member has a Brinell of H B = 275. Estimate the ultimate strength of the steel in MPa.