
Page 161 - Silence in Intercultural Communication
P. 161
148 Silence in Intercultural Communication
less, the lecturer’s perception that Miki's performance in her presentations was
surprisingly good, despite her overall silence, implies that silence is likely to be
viewed as an indicator of a lack of academic competence.
5.4.3.3 Case Study 3
Data from Case Study 3 reveals some interesting patterns when the quantitative
results of participation coding are compared with the participants’ perceptions
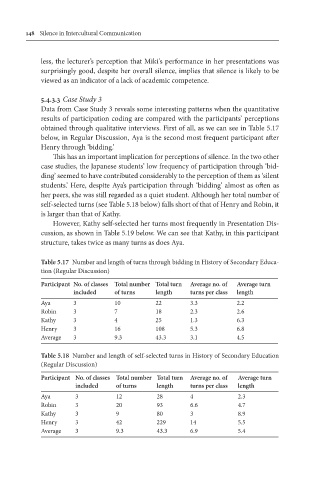
obtained through qualitative interviews. First of all, as we can see in Table 5.17
below, in Regular Discussion, Aya is the second most frequent participant after
Henry through ‘bidding.’
This has an important implication for perceptions of silence. In the two other
case studies, the Japanese students’ low frequency of participation through ‘bid-
ding’ seemed to have contributed considerably to the perception of them as ‘silent
students.’ Here, despite Aya’s participation through ‘bidding’ almost as often as
her peers, she was still regarded as a quiet student. Although her total number of
self-selected turns (see Table 5.18 below) falls short of that of Henry and Robin, it
is larger than that of Kathy.
However, Kathy self-selected her turns most frequently in Presentation Dis-
cussion, as shown in Table 5.19 below. We can see that Kathy, in this participant
structure, takes twice as many turns as does Aya.
Table 5.17 Number and length of turns through bidding in History of Secondary Educa-
tion (Regular Discussion)
Participant No. of classes Total number Total turn Average no. of Average turn
included of turns length turns per class length
Aya 3 10 22 3.3 2.2
Robin 3 7 18 2.3 2.6
Kathy 3 4 25 1.3 6.3
Henry 3 16 108 5.3 6.8
Average 3 9.3 43.3 3.1 4.5
Table 5.18 Number and length of self-selected turns in History of Secondary Education
(Regular Discussion)
Participant No. of classes Total number Total turn Average no. of Average turn
included of turns length turns per class length
Aya 3 12 28 4 2.3
Robin 3 20 93 6.6 4.7
Kathy 3 9 80 3 8.9
Henry 3 42 229 14 5.5
Average 3 9.3 43.3 6.9 5.4