
Page 123 - Six Sigma for electronics design and manufacturing
P. 123
Six Sigma for Electronics Design and Manufacturing
92
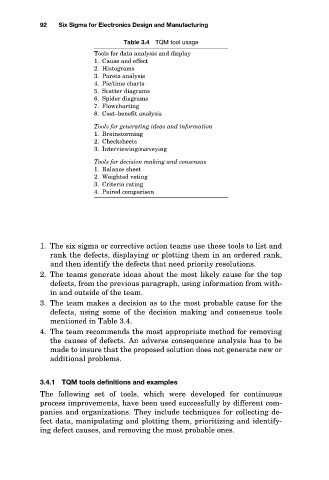
Table 3.4 TQM tool usage
Tools for data analysis and display
1. Cause and effect
2. Histograms
3. Pareto analysis
4. Pie/time charts
5. Scatter diagrams
6. Spider diagrams
7. Flowcharting
8. Cost–benefit analysis
Tools for generating ideas and information
1. Brainstorming
2. Checksheets
3. Interviewing/surveying
Tools for decision making and consensus
1. Balance sheet
2. Weighted voting
3. Criteria rating
4. Paired comparison
1. The six sigma or corrective action teams use these tools to list and
rank the defects, displaying or plotting them in an ordered rank,
and then identify the defects that need priority resolutions.
2. The teams generate ideas about the most likely cause for the top
defects, from the previous paragraph, using information from with-
in and outside of the team.
3. The team makes a decision as to the most probable cause for the
defects, using some of the decision making and consensus tools
mentioned in Table 3.4.
4. The team recommends the most appropriate method for removing
the causes of defects. An adverse consequence analysis has to be
made to insure that the proposed solution does not generate new or
additional problems.
3.4.1 TQM tools definitions and examples
The following set of tools, which were developed for continuous
process improvements, have been used successfully by different com-
panies and organizations. They include techniques for collecting de-
fect data, manipulating and plotting them, prioritizing and identify-
ing defect causes, and removing the most probable ones.