
Page 127 - Six Sigma for electronics design and manufacturing
P. 127
Six Sigma for Electronics Design and Manufacturing
96
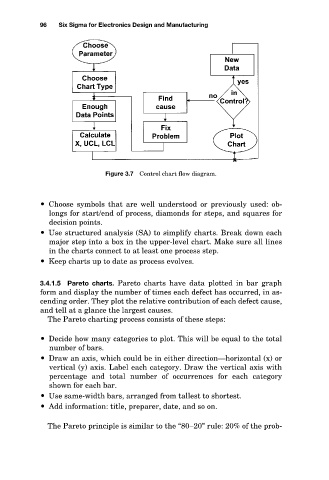
Figure 3.7 Control chart flow diagram.
Choose symbols that are well understood or previously used: ob-
longs for start/end of process, diamonds for steps, and squares for
decision points.
Use structured analysis (SA) to simplify charts. Break down each
major step into a box in the upper-level chart. Make sure all lines
in the charts connect to at least one process step.
Keep charts up to date as process evolves.
3.4.1.5 Pareto charts. Pareto charts have data plotted in bar graph
form and display the number of times each defect has occurred, in as-
cending order. They plot the relative contribution of each defect cause,
and tell at a glance the largest causes.
The Pareto charting process consists of these steps:
Decide how many categories to plot. This will be equal to the total
number of bars.
Draw an axis, which could be in either direction—horizontal (x) or
vertical (y) axis. Label each category. Draw the vertical axis with
percentage and total number of occurrences for each category
shown for each bar.
Use same-width bars, arranged from tallest to shortest.
Add information: title, preparer, date, and so on.
The Pareto principle is similar to the “80–20” rule: 20% of the prob-