
Page 140 - Six Sigma for electronics design and manufacturing
P. 140
Determining the Manufacturing Yield and Test Strategy
109
The defects from all operations add up to reduce line output quality
from the six sigma target.
The yield of the line is dependent on the complexity of the parts
and manufacturing operations. The more parts and operations, the
lower the yield. In addition, more operations require a much higher
level of quality for each operation in order to obtain a reasonable
overall line yield.
Although each operation or an incoming part could be evaluated for
six sigma or a targeted Cpk quality, the evaluation of the total line
quality is not readily apparent, and there can be many different op-
tions to do so. This section will explore different approaches to this
condition.
The yield of the line can be calculated using different methodolo-
gies, as shown in the previous section. This yield can result in dif-
ferent test strategies, depending on the economics of the alterna-
tive test methods to be used to bring up the final line quality to the
specified level.
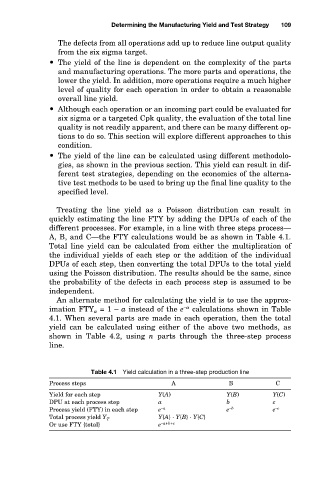
Treating the line yield as a Poisson distribution can result in
quickly estimating the line FTY by adding the DPUs of each of the
different processes. For example, in a line with three steps process—
A, B, and C—the FTY calculations would be as shown in Table 4.1.
Total line yield can be calculated from either the multiplication of
the individual yields of each step or the addition of the individual
DPUs of each step, then converting the total DPUs to the total yield
using the Poisson distribution. The results should be the same, since
the probability of the defects in each process step is assumed to be
independent.
An alternate method for calculating the yield is to use the approx-
imation FTY a = 1 – a instead of the e –a calculations shown in Table
4.1. When several parts are made in each operation, then the total
yield can be calculated using either of the above two methods, as
shown in Table 4.2, using n parts through the three-step process
line.
Table 4.1 Yield calculation in a three-step production line
Process steps A B C
Yield for each step Y(A) Y(B) Y(C)
DPU at each process step a b c
Process yield (FTY) in each step e –a e –b e –c
Y{A}· Y{B}· Y{C}
Total process yield Y T
Or use FTY {total} e –a+b+c