
Page 84 - Six Sigma for electronics design and manufacturing
P. 84
The Elements of Six Sigma and Their Determination
95.45 % 53
99.9936 %
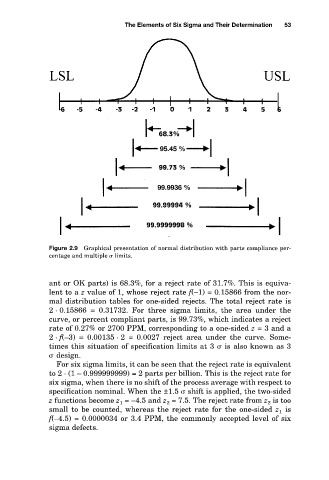
Figure 2.9 Graphical presentation of normal distribution with parts compliance per-
centage and multiple limits.
ant or OK parts) is 68.3%, for a reject rate of 31.7%. This is equiva-
lent to a z value of 1, whose reject rate f(–1) = 0.15866 from the nor-
mal distribution tables for one-sided rejects. The total reject rate is
2 · 0.15866 = 0.31732. For three sigma limits, the area under the
curve, or percent compliant parts, is 99.73%, which indicates a reject
rate of 0.27% or 2700 PPM, corresponding to a one-sided z = 3 and a
2· f(–3) = 0.00135 · 2 = 0.0027 reject area under the curve. Some-
times this situation of specification limits at 3 is also known as 3
design.
For six sigma limits, it can be seen that the reject rate is equivalent
to 2 · (1 – 0.999999999) = 2 parts per billion. This is the reject rate for
six sigma, when there is no shift of the process average with respect to
specification nominal. When the ±1.5 shift is applied, the two-sided
z functions become z 1 = –4.5 and z 2 = 7.5. The reject rate from z 2 is too
small to be counted, whereas the reject rate for the one-sided z 1 is
f(–4.5) = 0.0000034 or 3.4 PPM, the commonly accepted level of six
sigma defects.