
Page 193 -
P. 193
10 - PROJECT COMMUNICATIONS MANAGEMENT
10.2.3.4 Organizational Process Assets Updates
See Section 10.2.3.4 of the PMBOK Guide.
®
10
10.2.3.5 Special Communication Tools
Software projects that use adaptive life cycles often use special communications tools to specify and measure
scope, schedule, budget, progress, and risks. These communication tools may include product backlogs, release
maps, cumulative flow diagrams, and risk burndown charts. These terms are defined in the Glossary.
10.2.3.6 Online Collaboration Tools
Software projects often use online collaboration tools to share and communicate project status. These tools allow
geographically dispersed members to access project information. Online collaboration tools are also continuously
available to project groups that may be located in different time zones. Online collaboration tools can provide a rich
environment for storing documents, images, videos of product demonstrations, and threaded discussion forums.
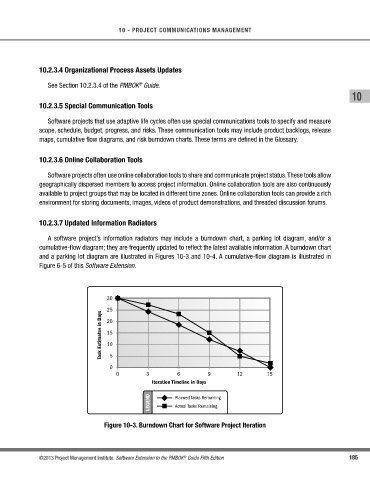
10.2.3.7 Updated Information Radiators
A software project’s information radiators may include a burndown chart, a parking lot diagram, and/or a
cumulative-flow diagram; they are frequently updated to reflect the latest available information. A burndown chart
and a parking lot diagram are illustrated in Figures 10-3 and 10-4. A cumulative-flow diagram is illustrated in
Figure 6-5 of this Software Extension.
30
25
Task Estimates in Days 15
20
10
0 5
0 3 6 9 12 15
Iteration Timeline in Days
LEGEND Planned Tasks Remaining
Actual Tasks Remaining
Figure 10-3. Burndown Chart for Software Project Iteration
©2013 Project Management Institute. Software Extension to the PMBOK Guide Fifth Edition 185
®