
Page 196 -
P. 196
10 - PROJECT COMMUNICATIONS MANAGEMENT
10.3.1.6 Prioritized Backlog
For adaptive software project life cycles, the prioritized product backlog plays a key role in controlling
communications. It is the primary method used to communicate the agreed-upon work and the sequence of
upcoming development. The backlog can be communicated using an online tool, a spreadsheet, or a stack of
task cards.
10.3.1.7 Velocity Statistics and Projections
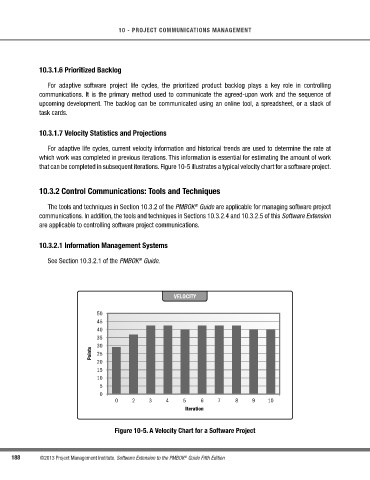
For adaptive life cycles, current velocity information and historical trends are used to determine the rate at
which work was completed in previous iterations. This information is essential for estimating the amount of work
that can be completed in subsequent iterations. Figure 10-5 illustrates a typical velocity chart for a software project.
10.3.2 Control Communications: Tools and Techniques
The tools and techniques in Section 10.3.2 of the PMBOK Guide are applicable for managing software project
®
communications. In addition, the tools and techniques in Sections 10.3.2.4 and 10.3.2.5 of this Software Extension
are applicable to controlling software project communications.
10.3.2.1 Information Management Systems
See Section 10.3.2.1 of the PMBOK Guide.
®
VELOCITY
50
45
40
35
30
Points 25
20
15
10
5
0
0 2 3 4 5 6 7 8 9 10
Iteration
Figure 10-5. A Velocity Chart for a Software Project
188 ©2013 Project Management Institute. Software Extension to the PMBOK Guide Fifth Edition
®