
Page 162 - Soil and water contamination, 2nd edition
P. 162
Radionuclides 149
2+
-
+
+
UO , UO H , (UO ) (OH) , and (UO ) (OH) occur in proportions depending on the
2 2 3 5 2 3 7
pH . In water containing carbonate, dissolved U(VI)-carbonate species predominate. These
0
2-
-
U(VI)-carbonate species include UO CO , UO (CO ) , and UO (CO ) . The anionic
2 3 2 3 2 2 3 3
U-carbonate species dominate at and above neutral pH and tend to cause the desorption
of U(VI) from mineral surfaces and the dissolution of U(VI) solids (Zhang et al., 2002). As
well as forming complexes with hydroxyl and carbonate, U(VI) also forms complexes with
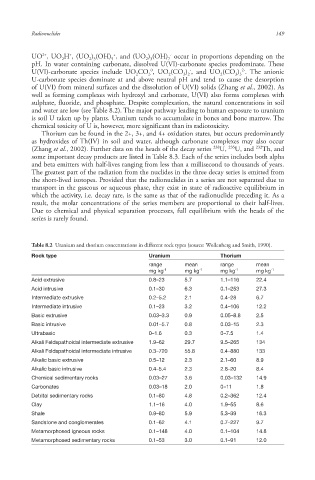
sulphate, fluoride, and phosphate. Despite complexation , the natural concentrations in soil
and water are low (see Table 8.2). The major pathway leading to human exposure to uranium
is soil U taken up by plants. Uranium tends to accumulate in bones and bone marrow. The
chemical toxicity of U is, however, more significant than its radiotoxicity.
Thorium can be found in the 2+, 3+, and 4+ oxidation state s, but occurs predominantly
as hydroxides of Th(IV) in soil and water, although carbonate complexes may also occur
235
238
232
(Zhang et al., 2002). Further data on the heads of the decay series U, U, and Th, and
some important decay products are listed in Table 8.3. Each of the series includes both alpha
and beta emitters with half-lives ranging from less than a millisecond to thousands of years.
The greatest part of the radiation from the nuclides in the three decay series is emitted from
the short-lived isotopes. Provided that the radionuclides in a series are not separated due to
transport in the gaseous or aqueous phase , they exist in state of radioactive equilibrium in
which the activity, i.e. decay rate, is the same as that of the radionuclide preceding it. As a
result, the molar concentrations of the series members are proportional to their half-lives.
Due to chemical and physical separation processes, full equilibrium with the heads of the
series is rarely found.
Table 8.2 Uranium and thorium concentrations in different rock types (source: Wollenberg and Smith, 1990).
Rock type Uranium Thorium
range mean range mean
mg kg -1 mg kg -1 mg kg -1 mg kg -1
Acid extrusive 0.8–23 5.7 1.1–116 22.4
Acid intrusive 0.1–30 6.3 0.1–253 27.3
Intermediate extrusive 0.2–5.2 2.1 0.4–28 6.7
Intermediate intrusive 0.1–23 3.2 0.4–106 12.2
Basic extrusive 0.03–3.3 0.9 0.05–8.8 2.5
Basic intrusive 0.01–5.7 0.8 0.03–15 2.3
Ultrabasic 0–1.6 0.3 0–7.5 1.4
Alkali Feldspathoidal intermediate extrusive 1.9–62 29.7 9.5–265 134
Alkali Feldspathoidal intermediate intrusive 0.3–720 55.8 0.4–880 133
Alkalic basic extrusive 0.5–12 2.3 2.1–60 8.9
Alkalic basic intrusive 0.4–5.4 2.3 2.8–20 8.4
Chemical sedimentary rocks 0.03–27 3.6 0.03–132 14.9
Carbonates 0.03–18 2.0 0–11 1.8
Detrital sedimentary rocks 0.1–80 4.8 0.2–362 12.4
Clay 1.1–16 4.0 1.9–55 8.6
Shale 0.9–80 5.9 5.3–39 16.3
Sandstone and conglomerates 0.1–62 4.1 0.7–227 9.7
Metamorphosed igneous rocks 0.1–148 4.0 0.1–104 14.8
Metamorphosed sedimentary rocks 0.1–53 3.0 0.1–91 12.0
10/1/2013 6:44:36 PM
Soil and Water.indd 161 10/1/2013 6:44:36 PM
Soil and Water.indd 161