
Page 197 - Solid Waste Analysis and Minimization a Systems Approach
P. 197
CASE STUDY—MAJOR WASTE STREAMS 175
Waste Minimization Alternative Feasibility Analysis Worksheet D (Page 2 of 2)
Purchasing Changes
Step 4: Cost analysis
New material costs
Previous material cost per load $
New material cost per load $
Material cost differential $
Annual loads purchased $
Annual material cost differential $
Operating expenses
Utility cost impacts $
Labor cost impacts $
Supervision cost impacts $
Maintenance cost impacts $
Operating and maintenance supply impacts $
Changes in overhead costs $
Operating savings and revenue
Reduced solid waste disposal costs $
Revenues from increased sale of recyclable material $
Revenues from the sale of by products $
Total initial investment $
Annual operating savings $
Payback period $
Net present value (NPV) $
Internal rate of return (IRR)
Organization minimum attractive rate of return (MARR)
Companies to purchase recycled material
$ per ton $
Exchange options
Step 5: Feedback analysis
Feedback from operators
Feedback from management
Feedback from maintenance
Feedback from finance
Step 6: Approval
Waste minimization, team leader
name date
Manager, maintenance
name date
Manager, operations
name date
Manager, finance
name date
CEO
name date
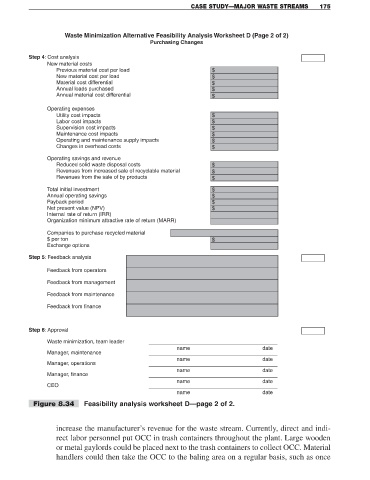
Figure 8.34 Feasibility analysis worksheet D—page 2 of 2.
increase the manufacturer’s revenue for the waste stream. Currently, direct and indi-
rect labor personnel put OCC in trash containers throughout the plant. Large wooden
or metal gaylords could be placed next to the trash containers to collect OCC. Material
handlers could then take the OCC to the baling area on a regular basis, such as once