
Page 201 - Solid Waste Analysis and Minimization a Systems Approach
P. 201
CASE STUDY—MAJOR WASTE STREAMS 179
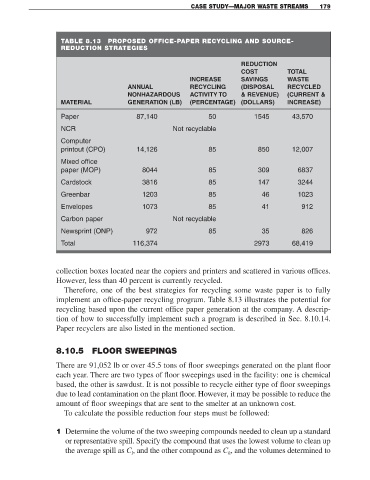
TABLE 8.13 PROPOSED OFFICE-PAPER RECYCLING AND SOURCE-
REDUCTION STRATEGIES
REDUCTION
COST TOTAL
INCREASE SAVINGS WASTE
ANNUAL RECYCLING (DISPOSAL RECYCLED
NONHAZARDOUS ACTIVITY TO & REVENUE) (CURRENT &
MATERIAL GENERATION (LB) (PERCENTAGE) (DOLLARS) INCREASE)
Paper 87,140 50 1545 43,570
NCR Not recyclable
Computer
printout (CPO) 14,126 85 850 12,007
Mixed office
paper (MOP) 8044 85 309 6837
Cardstock 3816 85 147 3244
Greenbar 1203 85 46 1023
Envelopes 1073 85 41 912
Carbon paper Not recyclable
Newsprint (ONP) 972 85 35 826
Total 116,374 2973 68,419
collection boxes located near the copiers and printers and scattered in various offices.
However, less than 40 percent is currently recycled.
Therefore, one of the best strategies for recycling some waste paper is to fully
implement an office-paper recycling program. Table 8.13 illustrates the potential for
recycling based upon the current office paper generation at the company. A descrip-
tion of how to successfully implement such a program is described in Sec. 8.10.14.
Paper recyclers are also listed in the mentioned section.
8.10.5 FLOOR SWEEPINGS
There are 91,052 lb or over 45.5 tons of floor sweepings generated on the plant floor
each year. There are two types of floor sweepings used in the facility: one is chemical
based, the other is sawdust. It is not possible to recycle either type of floor sweepings
due to lead contamination on the plant floor. However, it may be possible to reduce the
amount of floor sweepings that are sent to the smelter at an unknown cost.
To calculate the possible reduction four steps must be followed:
1 Determine the volume of the two sweeping compounds needed to clean up a standard
or representative spill. Specify the compound that uses the lowest volume to clean up
the average spill as C , and the other compound as C , and the volumes determined to
l
h