Page 315 - Solid Waste Analysis and Minimization a Systems Approach
P. 315
ANALYSIS OF RESULTS AND SUMMARY OF FINDINGS            293


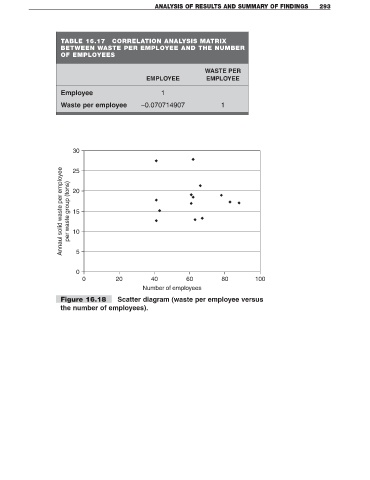
                     TABLE 16.17      CORRELATION ANALYSIS MATRIX
                     BETWEEN WASTE PER EMPLOYEE AND THE NUMBER
                     OF EMPLOYEES

                                                                     WASTE PER
                                                 EMPLOYEE            EMPLOYEE

                     Employee                         1
                     Waste per employee         −0.070714907              1


                         30

                     Annaul solid waste per employee per waste group (tons)  20
                         25


                         15


                         10


                          5


                          0
                            0          20          40          60         80         100
                                                Number of employees
                     Figure 16.18       Scatter diagram (waste per employee versus
                     the number of employees).

