
Page 311 - Solid Waste Analysis and Minimization a Systems Approach
P. 311
ANALYSIS OF RESULTS AND SUMMARY OF FINDINGS 289
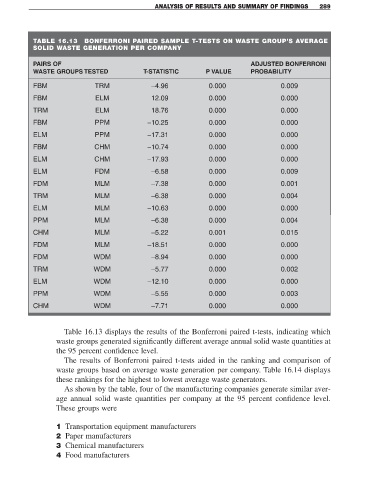
TABLE 16.13 BONFERRONI PAIRED SAMPLE T-TESTS ON WASTE GROUP’S AVERAGE
SOLID WASTE GENERATION PER COMPANY
PAIRS OF ADJUSTED BONFERRONI
WASTE GROUPS TESTED T-STATISTIC P VALUE PROBABILITY
FBM TRM −4.96 0.000 0.009
FBM ELM 12.09 0.000 0.000
TRM ELM 18.76 0.000 0.000
FBM PPM −10.25 0.000 0.000
ELM PPM −17.31 0.000 0.000
FBM CHM −10.74 0.000 0.000
ELM CHM −17.93 0.000 0.000
ELM FDM −6.58 0.000 0.009
FDM MLM −7.38 0.000 0.001
TRM MLM −6.38 0.000 0.004
ELM MLM −10.63 0.000 0.000
PPM MLM −6.38 0.000 0.004
CHM MLM −5.22 0.001 0.015
FDM MLM −18.51 0.000 0.000
FDM WDM −8.94 0.000 0.000
TRM WDM −5.77 0.000 0.002
ELM WDM −12.10 0.000 0.000
PPM WDM −5.55 0.000 0.003
CHM WDM −7.71 0.000 0.000
Table 16.13 displays the results of the Bonferroni paired t-tests, indicating which
waste groups generated significantly different average annual solid waste quantities at
the 95 percent confidence level.
The results of Bonferroni paired t-tests aided in the ranking and comparison of
waste groups based on average waste generation per company. Table 16.14 displays
these rankings for the highest to lowest average waste generators.
As shown by the table, four of the manufacturing companies generate similar aver-
age annual solid waste quantities per company at the 95 percent confidence level.
These groups were
1 Transportation equipment manufacturers
2 Paper manufacturers
3 Chemical manufacturers
4 Food manufacturers