
Page 312 - Solid Waste Analysis and Minimization a Systems Approach
P. 312
290 SOLID WASTE ESTIMATION AND PREDICTION
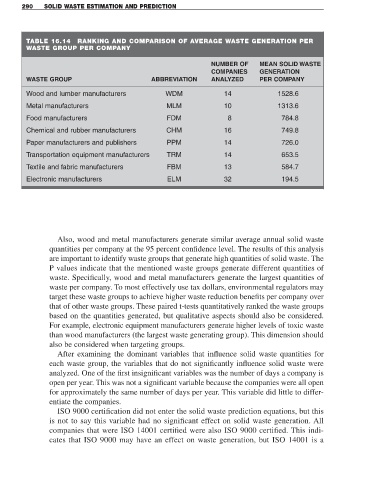
TABLE 16.14 RANKING AND COMPARISON OF AVERAGE WASTE GENERATION PER
WASTE GROUP PER COMPANY
NUMBER OF MEAN SOLID WASTE
COMPANIES GENERATION
WASTE GROUP ABBREVIATION ANALYZED PER COMPANY
Wood and lumber manufacturers WDM 14 1528.6
Metal manufacturers MLM 10 1313.6
Food manufacturers FDM 8 784.8
Chemical and rubber manufacturers CHM 16 749.8
Paper manufacturers and publishers PPM 14 726.0
Transportation equipment manufacturers TRM 14 653.5
Textile and fabric manufacturers FBM 13 584.7
Electronic manufacturers ELM 32 194.5
Also, wood and metal manufacturers generate similar average annual solid waste
quantities per company at the 95 percent confidence level. The results of this analysis
are important to identify waste groups that generate high quantities of solid waste. The
P values indicate that the mentioned waste groups generate different quantities of
waste. Specifically, wood and metal manufacturers generate the largest quantities of
waste per company. To most effectively use tax dollars, environmental regulators may
target these waste groups to achieve higher waste reduction benefits per company over
that of other waste groups. These paired t-tests quantitatively ranked the waste groups
based on the quantities generated, but qualitative aspects should also be considered.
For example, electronic equipment manufacturers generate higher levels of toxic waste
than wood manufacturers (the largest waste generating group). This dimension should
also be considered when targeting groups.
After examining the dominant variables that influence solid waste quantities for
each waste group, the variables that do not significantly influence solid waste were
analyzed. One of the first insignificant variables was the number of days a company is
open per year. This was not a significant variable because the companies were all open
for approximately the same number of days per year. This variable did little to differ-
entiate the companies.
ISO 9000 certification did not enter the solid waste prediction equations, but this
is not to say this variable had no significant effect on solid waste generation. All
companies that were ISO 14001 certified were also ISO 9000 certified. This indi-
cates that ISO 9000 may have an effect on waste generation, but ISO 14001 is a