Page 310 - Solid Waste Analysis and Minimization a Systems Approach
P. 310

288     SOLID WASTE ESTIMATION AND PREDICTION
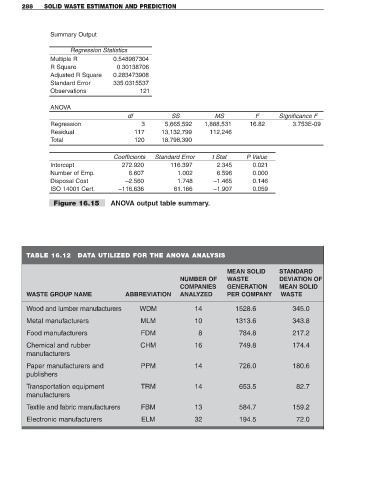


                  Summary Output

                        Regression Statistics
                  Multiple R          0.548987304
                  R Square              0.30138706
                  Adjusted R Square   0.283473908
                  Standard Error      335.0315537
                  Observations                 121


                  ANOVA
                                           df             SS            MS           F       Significance F
                  Regression                    3       5,665,592    1,888,531      16.82         3.753E-09
                  Residual                   117      13,132,799      112,246
                  Total                      120      18,798,390


                                       Coefficients  Standard Error    t Stat     P Value
                  Intercept              272.920         116.397         2.345       0.021
                  Number of Emp.            6.607           1.002        6.596       0.000
                  Disposal Cost           –2.560            1.748       –1.465       0.146
                  ISO 14001 Cert.       –116.636           61.166       –1.907       0.059

                   Figure 16.15       ANOVA output table summary.


          TABLE 16.12      DATA UTILIZED FOR THE ANOVA ANALYSIS


                                                                            MEAN SOLID       STANDARD
                                                             NUMBER OF      WASTE            DEVIATION OF
                                                             COMPANIES      GENERATION       MEAN SOLID
          WASTE GROUP NAME                ABBREVIATION       ANALYZED       PER COMPANY       WASTE

          Wood and lumber manufacturers        WDM               14            1528.6             345.0

          Metal manufacturers                   MLM              10            1313.6             343.8
          Food manufacturers                    FDM                8            784.8             217.2

          Chemical and rubber                  CHM               16             749.8             174.4
          manufacturers

          Paper manufacturers and               PPM              14             726.0             180.6
          publishers
          Transportation equipment              TRM              14             653.5              82.7
          manufacturers
          Textile and fabric manufacturers      FBM              13             584.7             159.2

          Electronic manufacturers              ELM              32             194.5              72.0
   305   306   307   308   309   310   311   312   313   314   315