
Page 307 - Solid Waste Analysis and Minimization a Systems Approach
P. 307
ANALYSIS OF RESULTS AND SUMMARY OF FINDINGS 285
TABLE 16.10 WASTE GROUP COMPARISON OF THE AVERAGE SOLID WASTE PER
COMPANY VERSUS THE REGRESSION COEFFICIENT FOR LANDFILL DISPOSAL COSTS
AVERAGE SOLID LANDFILL
WASTE PER DISPOSAL COST
COMPANY PER REGRESSION
WASTE GROUP ABBREVIATION YEAR (TONS) COEFFICIENT T VALUE
Wood and lumber WDM 1707.9 −7.76 −3.73
manufacturers
Metal manufacturers MLM 1313.6 −7.51 −3.08
Food manufacturers FDM 784.8 −5.17 −2.85
Textile and fabric FBM 584.7 −3.78 −3.02
manufacturers
Paper manufacturers and PPM 726.0 −3.51 −2.65
publishers
Chemical and rubber CHM 749.8 −3.49 −2.54
manufacturers
Transportation equipment TRM 653.5 −1.73 −3.38
manufacturers
Electronic manufacturers ELM 194.5 −0.83 −2.27
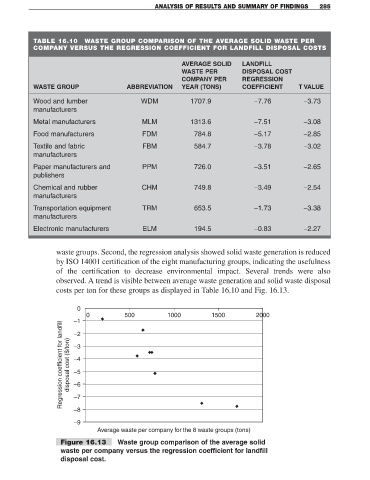
waste groups. Second, the regression analysis showed solid waste generation is reduced
by ISO 14001 certification of the eight manufacturing groups, indicating the usefulness
of the certification to decrease environmental impact. Several trends were also
observed. A trend is visible between average waste generation and solid waste disposal
costs per ton for these groups as displayed in Table 16.10 and Fig. 16.13.
0
0 500 1000 1500 2000
–1
Regression coefficient for landfill disposal cost ($/ton) –3
–2
–4
–5
–6
–7
–8
–9
Average waste per company for the 8 waste groups (tons)
Figure 16.13 Waste group comparison of the average solid
waste per company versus the regression coefficient for landfill
disposal cost.