Page 303 - Solid Waste Analysis and Minimization a Systems Approach
P. 303

ANALYSIS OF RESULTS AND SUMMARY OF FINDINGS            281


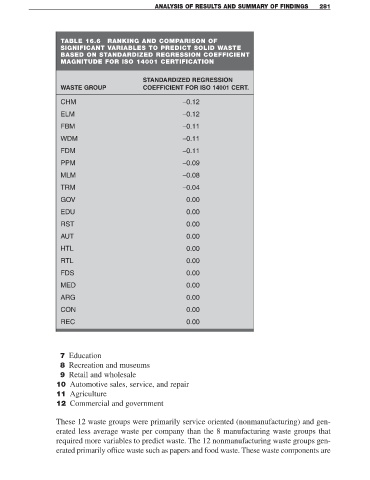
                     TABLE 16.6      RANKING AND COMPARISON OF
                     SIGNIFICANT VARIABLES TO PREDICT SOLID WASTE
                     BASED ON STANDARDIZED REGRESSION COEFFICIENT
                     MAGNITUDE FOR ISO 14001 CERTIFICATION


                                                STANDARDIZED REGRESSION
                     WASTE GROUP                COEFFICIENT FOR ISO 14001 CERT.
                     CHM                                     −0.12

                     ELM                                     −0.12

                     FBM                                     −0.11
                     WDM                                     −0.11
                     FDM                                     −0.11

                     PPM                                     −0.09

                     MLM                                     −0.08
                     TRM                                     −0.04

                     GOV                                       0.00
                     EDU                                       0.00

                     RST                                       0.00
                     AUT                                       0.00

                     HTL                                       0.00
                     RTL                                       0.00

                     FDS                                       0.00
                     MED                                       0.00

                     ARG                                       0.00
                     CON                                       0.00

                     REC                                       0.00


                     7 Education
                     8 Recreation and museums
                     9 Retail and wholesale
                    10 Automotive sales, service, and repair
                    11 Agriculture
                    12 Commercial and government


                    These 12 waste groups were primarily service oriented (nonmanufacturing) and gen-
                    erated less average waste per company than the 8 manufacturing waste groups that
                    required more variables to predict waste. The 12 nonmanufacturing waste groups gen-
                    erated primarily office waste such as papers and food waste. These waste components are
   298   299   300   301   302   303   304   305   306   307   308