Page 304 - Solid Waste Analysis and Minimization a Systems Approach
P. 304

282     SOLID WASTE ESTIMATION AND PREDICTION


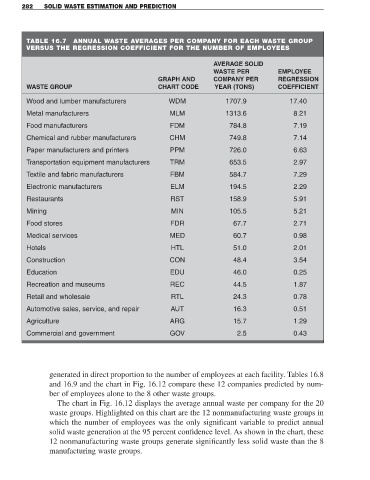
          TABLE 16.7     ANNUAL WASTE AVERAGES PER COMPANY FOR EACH WASTE GROUP
          VERSUS THE REGRESSION COEFFICIENT FOR THE NUMBER OF EMPLOYEES


                                                                        AVERAGE SOLID
                                                                        WASTE PER            EMPLOYEE
                                                     GRAPH AND          COMPANY PER          REGRESSION
          WASTE GROUP                                CHART CODE         YEAR (TONS)          COEFFICIENT

          Wood and lumber manufacturers                  WDM                1707.9               17.40

          Metal manufacturers                            MLM                1313.6                8.21
          Food manufacturers                             FDM                 784.8                7.19

          Chemical and rubber manufacturers              CHM                 749.8                7.14
          Paper manufacturers and printers               PPM                 726.0                6.63

          Transportation equipment manufacturers         TRM                 653.5                2.97
          Textile and fabric manufacturers               FBM                 584.7                7.29

          Electronic manufacturers                       ELM                 194.5                2.29
          Restaurants                                    RST                 158.9                5.91

          Mining                                          MIN                105.5                5.21

          Food stores                                    FDR                  67.7                2.71
          Medical services                               MED                  60.7                0.98
          Hotels                                          HTL                 51.0                2.01

          Construction                                   CON                  48.4                3.54

          Education                                      EDU                  46.0                0.25
          Recreation and museums                         REC                  44.5                1.87

          Retail and wholesale                            RTL                 24.3                0.78
          Automotive sales, service, and repair          AUT                  16.3                0.51

          Agriculture                                    ARG                  15.7                1.29
          Commercial and government                      GOV                   2.5                0.43


                 generated in direct proportion to the number of employees at each facility. Tables 16.8
                 and 16.9 and the chart in Fig. 16.12 compare these 12 companies predicted by num-
                 ber of employees alone to the 8 other waste groups.
                    The chart in Fig. 16.12 displays the average annual waste per company for the 20
                 waste groups. Highlighted on this chart are the 12 nonmanufacturing waste groups in
                 which the number of employees was the only significant variable to predict annual
                 solid waste generation at the 95 percent confidence level. As shown in the chart, these
                 12 nonmanufacturing waste groups generate significantly less solid waste than the 8
                 manufacturing waste groups.
   299   300   301   302   303   304   305   306   307   308   309