Page 299 - Solid Waste Analysis and Minimization a Systems Approach
P. 299

ANALYSIS OF RESULTS AND SUMMARY OF FINDINGS            277


                        1.00

                        0.90
                        0.80

                        0.70

                        0.60                                                           ISO 14001
                                                                                       Cost
                      R 2  0.50
                                                                                       Employee
                        0.40

                        0.30

                        0.20

                        0.10
                        0.00
                               MLM  FDM  WDM  GOV  FBM  MIN  CHM  EDU  PPM  RST  AUT  HTL  RTL  FDS  MED  CON  ARG  TRM  ELM  REC


                                                20 Waste groups
                                                                        2
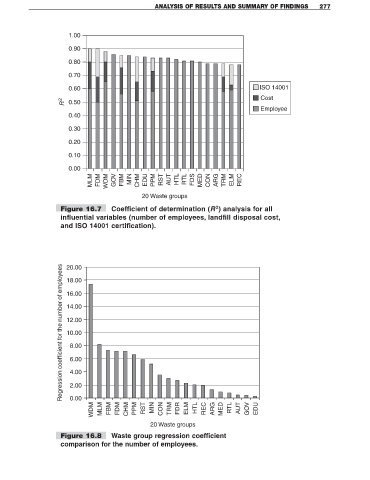
                     Figure 16.7      Coefficient of determination (R ) analysis for all
                     influential variables (number of employees, landfill disposal cost,
                     and ISO 14001 certification).


                     Regression coefficient for the number of employees
                       20.00
                       18.00

                       16.00

                       14.00

                       12.00
                       10.00

                        8.00

                        6.00
                        4.00

                        2.00

                        0.00
                                WDM  MLM  FBM  FDM  CHM  PPM  RST  MIN  CON  TRM  FDR  ELM  HTL  REC  ARG  MED  RTL  AUT  GOV  EDU


                                                   20 Waste groups
                     Figure 16.8      Waste group regression coefficient
                     comparison for the number of employees.
   294   295   296   297   298   299   300   301   302   303   304