Page 296 - Solid Waste Analysis and Minimization a Systems Approach
P. 296

274     SOLID WASTE ESTIMATION AND PREDICTION


                 16.4 Analysis of Results and


                 Summary of Findings


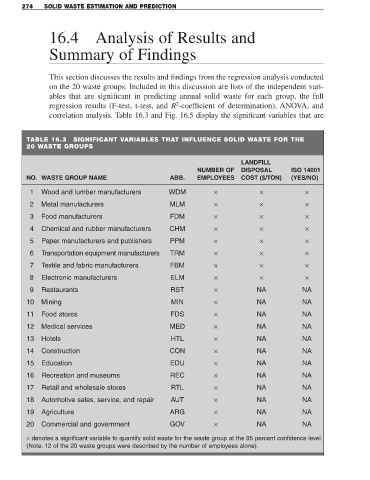
                 This section discusses the results and findings from the regression analysis conducted
                 on the 20 waste groups. Included in this discussion are lists of the independent vari-
                 ables that are significant in predicting annual solid waste for each group, the full
                                                           2
                 regression results (F-test, t-test, and R -coefficient of determination), ANOVA, and
                 correlation analysis. Table 16.3 and Fig. 16.5 display the significant variables that are


          TABLE 16.3     SIGNIFICANT VARIABLES THAT INFLUENCE SOLID WASTE FOR THE
          20 WASTE GROUPS

                                                                                 LANDFILL
                                                                  NUMBER OF  DISPOSAL            ISO 14001
          NO. WASTE GROUP NAME                           ABB.     EMPLOYEES      COST ($/TON)    (YES/NO)

           1   Wood and lumber manufacturers             WDM            ×              ×              ×

           2   Metal manufacturers                       MLM            ×              ×              ×
           3   Food manufacturers                        FDM            ×              ×              ×

           4   Chemical and rubber manufacturers         CHM            ×              ×              ×
           5   Paper manufacturers and publishers        PPM            ×              ×              ×

           6   Transportation equipment manufacturers    TRM            ×              ×              ×
           7   Textile and fabric manufacturers          FBM            ×              ×              ×

           8   Electronic manufacturers                  ELM            ×              ×              ×
           9   Restaurants                               RST            ×             NA             NA

          10   Mining                                     MIN           ×             NA             NA
          11   Food stores                               FDS            ×             NA             NA

          12   Medical services                          MED            ×             NA             NA
          13   Hotels                                     HTL           ×             NA             NA

          14   Construction                              CON            ×             NA             NA
          15   Education                                 EDU            ×             NA             NA

          16   Recreation and museums                    REC            ×             NA             NA
          17   Retail and wholesale stores                RTL           ×             NA             NA

          18   Automotive sales, service, and repair     AUT            ×             NA             NA
          19   Agriculture                               ARG            ×             NA             NA

          20   Commercial and government                 GOV            ×             NA             NA

          × denotes a significant variable to quantify solid waste for the waste group at the 95 percent confidence level.
          (Note: 12 of the 20 waste groups were described by the number of employees alone).
   291   292   293   294   295   296   297   298   299   300   301