
Page 291 - Solid Waste Analysis and Minimization a Systems Approach
P. 291
STEPWISE REGRESSION METHODOLOGY 269
and
n
y −
SSR = ∑ ( ˆ i y) 2 = regression sum of squares
i=1
There are k degrees of freedom associated with SSR and SST has n − 1 degrees of
freedom. Therefore, after subtraction, SSE has n – k − 1 degrees of freedom. The esti-
mate of σ 2 is given by the error sum of squares divided by the degrees of freedom
(Walpole and Myers, 1993). All three of the sums of squares appear on the printout of
most multiple regression computer packages, including Minitab, which was used for
this research. Minitab and SYSTAT were used to calculate these values. SYSTAT was
used to verify results.
The F statistic is calculated using the following equation:
f = SSR k / = SSR k /
−− )1
/(
SSE n k s 2
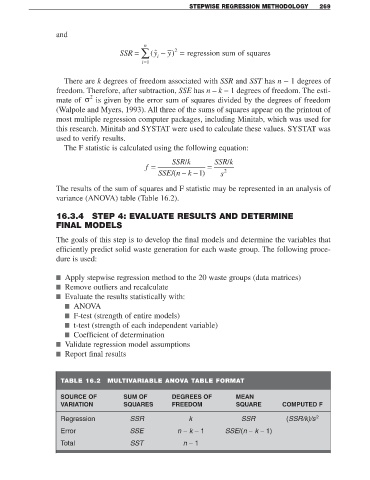
The results of the sum of squares and F statistic may be represented in an analysis of
variance (ANOVA) table (Table 16.2).
16.3.4 STEP 4: EVALUATE RESULTS AND DETERMINE
FINAL MODELS
The goals of this step is to develop the final models and determine the variables that
efficiently predict solid waste generation for each waste group. The following proce-
dure is used:
■ Apply stepwise regression method to the 20 waste groups (data matrices)
■ Remove outliers and recalculate
■ Evaluate the results statistically with:
■ ANOVA
■ F-test (strength of entire models)
■ t-test (strength of each independent variable)
■ Coefficient of determination
■ Validate regression model assumptions
■ Report final results
TABLE 16.2 MULTIVARIABLE ANOVA TABLE FORMAT
SOURCE OF SUM OF DEGREES OF MEAN
VARIATION SQUARES FREEDOM SQUARE COMPUTED F
Regression SSR k SSR (SSR/k)/s 2
Error SSE n − k − 1 SSE/(n − k − 1)
Total SST n − 1