
Page 293 - Solid Waste Analysis and Minimization a Systems Approach
P. 293
STEPWISE REGRESSION METHODOLOGY 271
of squares (Walpole and Myers, 1993). The decision is whether the increase in the
regression is sufficient to warrant using the variable in the model. The use of unim-
portant variables can reduce the effectiveness of the prediction equation by increasing
the variance of the estimated response (Walpole and Myers, 1993). The following
mathematics illustrate the method used to evaluate individual coefficients and deter-
mine if each variable effectively aids in predicting total annual waste.
A t-test, which is a statistical test on a sample from a normally distributed population,
was conducted at the 95 percent confidence level to determine if there was significant
correlation between the variables. The null hypothesis (H ) was defined such that the
0
slope of the population regression line (β ) is zero, in other words variables are not cor-
i
related. This would mean that there is no linear relationship between the independent
variables (x ) and dependent variables (y ). The alternate hypothesis (H ) states that the
1
i
i
slope of the population regression is not equal to zero, in other words, the tested vari-
ables are correlated and do have a relationship. The t-tests were conducted as follows:
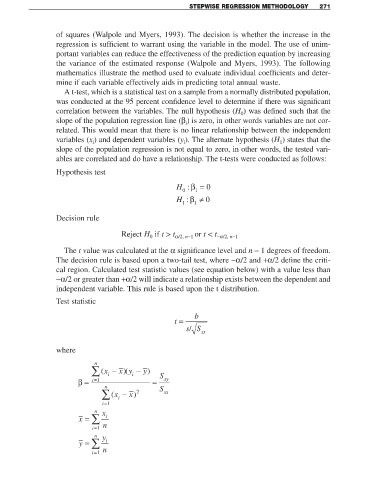
Hypothesis test
H : β = 0
0 1
H : β ≠ 0
1 1
Decision rule
Reject H if t > t α/2, n−1 or t < t −α/2, n−1
0
The t value was calculated at the α significance level and n − 1 degrees of freedom.
The decision rule is based upon a two-tail test, where −α/2 and +α/2 define the criti-
cal region. Calculated test statistic values (see equation below) with a value less than
−α/2 or greater than +α/2 will indicate a relationship exists between the dependent and
independent variable. This rule is based upon the t distribution.
Test statistic
t = b
sS
/
xx
where
n
∑ (x i − )(x y i − )y
β= = i 1 n = S xy
∑ (x i − )x 2 S xx
= i 1
n
x = ∑ x i
i i=1 n
n
y = ∑ y i
i=1 n