
Page 298 - Solid Waste Analysis and Minimization a Systems Approach
P. 298
276 SOLID WASTE ESTIMATION AND PREDICTION
1.00
0.90
0.80
0.70
0.60
R 2 0.50
0.40
0.30
0.20
0.10
0.00
GOV MIN EDU RST AUT HTL RTL FDS MED CON ARG REC WDM MLM ELM PPM TRM FBM CHM FDM
20 Waste groups
2
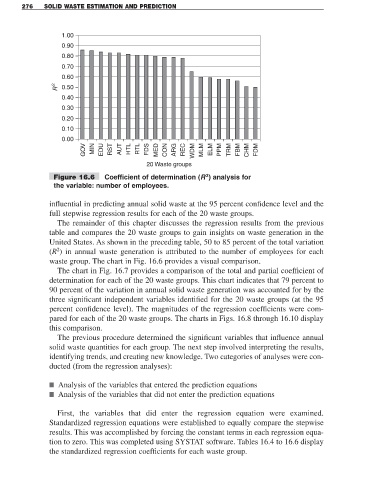
Figure 16.6 Coefficient of determination (R ) analysis for
the variable: number of employees.
influential in predicting annual solid waste at the 95 percent confidence level and the
full stepwise regression results for each of the 20 waste groups.
The remainder of this chapter discusses the regression results from the previous
table and compares the 20 waste groups to gain insights on waste generation in the
United States. As shown in the preceding table, 50 to 85 percent of the total variation
2
(R ) in annual waste generation is attributed to the number of employees for each
waste group. The chart in Fig. 16.6 provides a visual comparison.
The chart in Fig. 16.7 provides a comparison of the total and partial coefficient of
determination for each of the 20 waste groups. This chart indicates that 79 percent to
90 percent of the variation in annual solid waste generation was accounted for by the
three significant independent variables identified for the 20 waste groups (at the 95
percent confidence level). The magnitudes of the regression coefficients were com-
pared for each of the 20 waste groups. The charts in Figs. 16.8 through 16.10 display
this comparison.
The previous procedure determined the significant variables that influence annual
solid waste quantities for each group. The next step involved interpreting the results,
identifying trends, and creating new knowledge. Two categories of analyses were con-
ducted (from the regression analyses):
■ Analysis of the variables that entered the prediction equations
■ Analysis of the variables that did not enter the prediction equations
First, the variables that did enter the regression equation were examined.
Standardized regression equations were established to equally compare the stepwise
results. This was accomplished by forcing the constant terms in each regression equa-
tion to zero. This was completed using SYSTAT software. Tables 16.4 to 16.6 display
the standardized regression coefficients for each waste group.