
Page 301 - Solid Waste Analysis and Minimization a Systems Approach
P. 301
ANALYSIS OF RESULTS AND SUMMARY OF FINDINGS 279
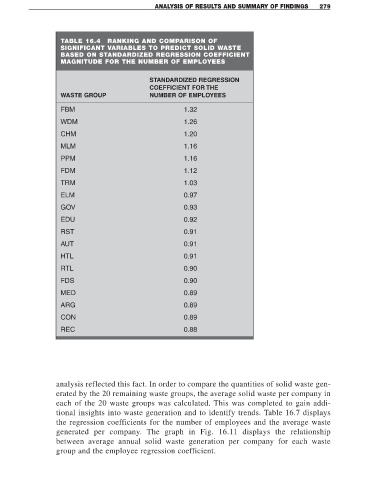
TABLE 16.4 RANKING AND COMPARISON OF
SIGNIFICANT VARIABLES TO PREDICT SOLID WASTE
BASED ON STANDARDIZED REGRESSION COEFFICIENT
MAGNITUDE FOR THE NUMBER OF EMPLOYEES
STANDARDIZED REGRESSION
COEFFICIENT FOR THE
WASTE GROUP NUMBER OF EMPLOYEES
FBM 1.32
WDM 1.26
CHM 1.20
MLM 1.16
PPM 1.16
FDM 1.12
TRM 1.03
ELM 0.97
GOV 0.93
EDU 0.92
RST 0.91
AUT 0.91
HTL 0.91
RTL 0.90
FDS 0.90
MED 0.89
ARG 0.89
CON 0.89
REC 0.88
analysis reflected this fact. In order to compare the quantities of solid waste gen-
erated by the 20 remaining waste groups, the average solid waste per company in
each of the 20 waste groups was calculated. This was completed to gain addi-
tional insights into waste generation and to identify trends. Table 16.7 displays
the regression coefficients for the number of employees and the average waste
generated per company. The graph in Fig. 16.11 displays the relationship
between average annual solid waste generation per company for each waste
group and the employee regression coefficient.