
Page 306 - Solid Waste Analysis and Minimization a Systems Approach
P. 306
284 SOLID WASTE ESTIMATION AND PREDICTION
TABLE 16.9 MANUFACTURING WASTE GROUP COMPARISON OF AVERAGE SOLID
WASTE PER COMPANY VERSUS THE REGRESSION COEFFICIENT FOR THE NUMBER
OF EMPLOYEES
AVERAGE SOLID EMPLOYEE
WASTE PER COMPANY REGRESSION
WASTE GROUP ABBREVIATION PER YEAR (TONS) COEFFICIENT
Wood and lumber manufacturers WDM 1707.9 17.40
Metal manufacturers MLM 1313.6 8.21
Food manufacturers FDM 784.8 7.19
Chemical and rubber manufacturers CHM 749.8 7.14
Paper manufacturers and printers PPM 726.0 6.63
Transportation equipment manufacturers TRM 653.5 2.97
Textile and fabric manufacturers FBM 584.7 7.29
Electronic manufacturers ELM 194.5 2.29
After investigating the eight solid waste groups that were predicted by variables in
addition to the number of employees, several trends were identified. In addition to the
number of employees the eight solid waste groups were predicted by solid waste dis-
posal costs per ton and ISO 14001 certification. These two additional variables acted as
dampeners in the regression equation by reducing the amounts of waste generated. The
results of the regression analysis for the eight manufacturing waste groups provided
two insights. First, these waste groups are more sensitive to waste costs and have higher
incentives to reduce waste in order to reduce costs over that of the 12 nonmanufacturing
1800
1600
Annual solid waste (tons) 1200
1400
1000
800
600
Low average annual solid waste
400
generators
200
0
WDM MLM FDM CHM PPM TRM FBM ELM RST MIN FDS MED HTL CON EDU REC RTL AUT ARG GOV
20 Waste groups
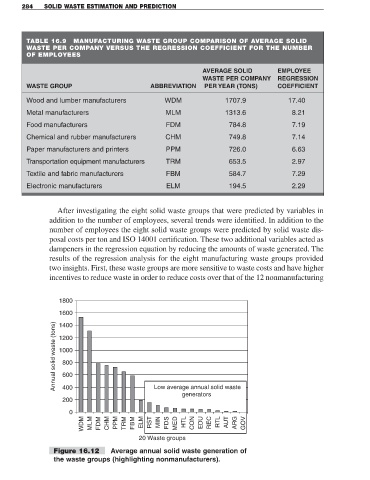
Figure 16.12 Average annual solid waste generation of
the waste groups (highlighting nonmanufacturers).