
Page 309 - Solid Waste Analysis and Minimization a Systems Approach
P. 309
ANALYSIS OF RESULTS AND SUMMARY OF FINDINGS 287
0
0 500 1000 1500 2000
Regression coefficient for ISO 14001 certification –100
–50
–150
–200
–250
Average waste per company for the 8 waste groups (tons)
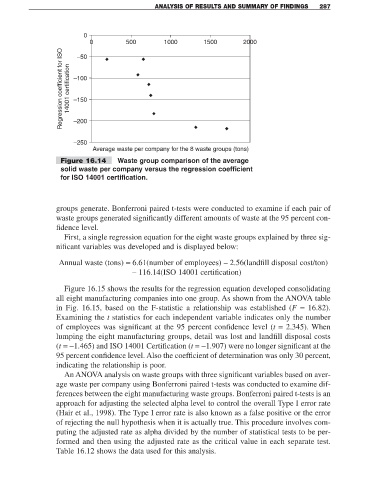
Figure 16.14 Waste group comparison of the average
solid waste per company versus the regression coefficient
for ISO 14001 certification.
groups generate. Bonferroni paired t-tests were conducted to examine if each pair of
waste groups generated significantly different amounts of waste at the 95 percent con-
fidence level.
First, a single regression equation for the eight waste groups explained by three sig-
nificant variables was developed and is displayed below:
Annual waste (tons) = 6.61(number of employees) – 2.56(landfill disposal cost/ton)
– 116.14(ISO 14001 certification)
Figure 16.15 shows the results for the regression equation developed consolidating
all eight manufacturing companies into one group. As shown from the ANOVA table
in Fig. 16.15, based on the F-statistic a relationship was established (F = 16.82).
Examining the t statistics for each independent variable indicates only the number
of employees was significant at the 95 percent confidence level (t = 2.345). When
lumping the eight manufacturing groups, detail was lost and landfill disposal costs
(t =−1.465) and ISO 14001 Certification (t =−1.907) were no longer significant at the
95 percent confidence level. Also the coefficient of determination was only 30 percent,
indicating the relationship is poor.
An ANOVA analysis on waste groups with three significant variables based on aver-
age waste per company using Bonferroni paired t-tests was conducted to examine dif-
ferences between the eight manufacturing waste groups. Bonferroni paired t-tests is an
approach for adjusting the selected alpha level to control the overall Type I error rate
(Hair et al., 1998). The Type I error rate is also known as a false positive or the error
of rejecting the null hypothesis when it is actually true. This procedure involves com-
puting the adjusted rate as alpha divided by the number of statistical tests to be per-
formed and then using the adjusted rate as the critical value in each separate test.
Table 16.12 shows the data used for this analysis.