
Page 314 - Solid Waste Analysis and Minimization a Systems Approach
P. 314
292 SOLID WASTE ESTIMATION AND PREDICTION
TABLE 16.16 CORRELATION ANALYSIS
MATRIX BETWEEN ISO 14001 CERTIFI-
CATION AND RECYCLING LEVEL
ISO RECYCLE
ISO 14001 1
Recycle 0.716744711 1
The following equation was used to calculate the correlation coefficients (Walpole
and Myers, 1993):
S S
r = b xx = b xy
S SS
yy xx yy
An analysis was conducted to examine the effects of company size on waste gener-
ation per employee. The purpose of the test was to examine if larger companies were
more or less efficient than smaller companies in regards to waste generation. For all
groups no significant correlation was found. Table 16.17 and Fig. 16.18 show the
results for the wood and lumber manufacturing waste group.
Also notable, nonlinear variables did not aid in the prediction of solid waste.
Significant relationships were developed using linear variables at the 95 percent con-
fidence level. The next chapter discusses the development of the performance param-
eters for the 20 waste groups. The regression equations discussed in this chapter
served as the basis of these parameters.
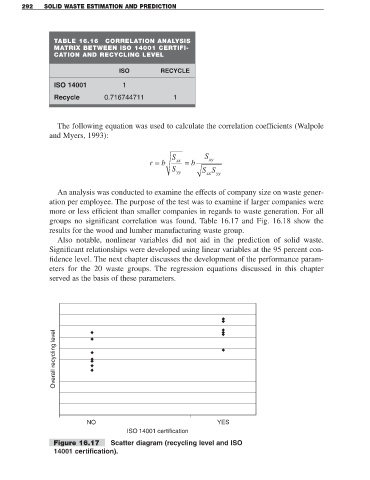
Overall recycling level
NO YES
ISO 14001 certification
Figure 16.17 Scatter diagram (recycling level and ISO
14001 certification).