
Page 313 - Solid Waste Analysis and Minimization a Systems Approach
P. 313
ANALYSIS OF RESULTS AND SUMMARY OF FINDINGS 291
TABLE 16.15 CORRELATION ANALYSIS
MATRIX BETWEEN DISPOSAL COST
AND RECYCLING LEVEL
COST RECYCLE
Cost 1
Recycle 0.728647381 1
stronger predictor. This is logical because ISO 14001 is an environmental quality
system and ISO 9000 is a general quality system.
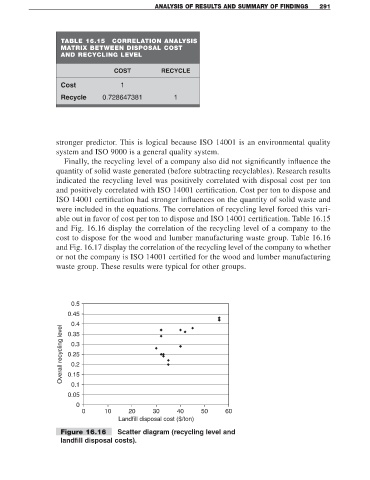
Finally, the recycling level of a company also did not significantly influence the
quantity of solid waste generated (before subtracting recyclables). Research results
indicated the recycling level was positively correlated with disposal cost per ton
and positively correlated with ISO 14001 certification. Cost per ton to dispose and
ISO 14001 certification had stronger influences on the quantity of solid waste and
were included in the equations. The correlation of recycling level forced this vari-
able out in favor of cost per ton to dispose and ISO 14001 certification. Table 16.15
and Fig. 16.16 display the correlation of the recycling level of a company to the
cost to dispose for the wood and lumber manufacturing waste group. Table 16.16
and Fig. 16.17 display the correlation of the recycling level of the company to whether
or not the company is ISO 14001 certified for the wood and lumber manufacturing
waste group. These results were typical for other groups.
0.5
0.45
0.4
Overall recycling level 0.25
0.35
0.3
0.2
0.15
0.1
0.05
0
0 10 20 30 40 50 60
Landfill disposal cost ($/ton)
Figure 16.16 Scatter diagram (recycling level and
landfill disposal costs).