
Page 308 - Solid Waste Analysis and Minimization a Systems Approach
P. 308
286 SOLID WASTE ESTIMATION AND PREDICTION
Examining the t values, allows for a comparison of the landfill disposal cost
effects on the eight manufacturing waste groups. Wood and lumber manufacturers
indicated the highest absolute value at 3.73 followed by transportation equipment
manufacturers at 3.38. These two waste groups achieve greater waste reduction from
increased waste costs, indicating they are more sensitive to the economic impact of
waste generation. On the contrary, electronic manufacturers and chemical manufac-
turers were least sensitive.
As shown, the greater the average waste per company a waste group generates, the
more costly the regression cost coefficient. This indicates solid waste generation is
economically driven. The more waste a company within the groups generates the more
sensitive to disposal costs.
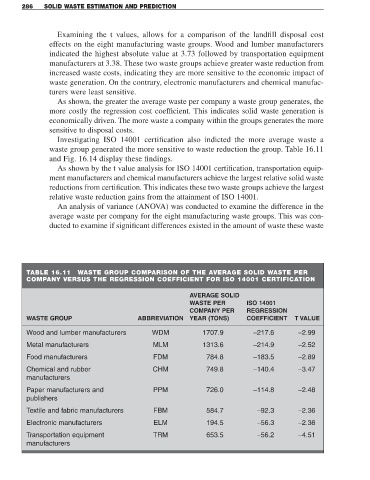
Investigating ISO 14001 certification also indicted the more average waste a
waste group generated the more sensitive to waste reduction the group. Table 16.11
and Fig. 16.14 display these findings.
As shown by the t value analysis for ISO 14001 certification, transportation equip-
ment manufacturers and chemical manufacturers achieve the largest relative solid waste
reductions from certification. This indicates these two waste groups achieve the largest
relative waste reduction gains from the attainment of ISO 14001.
An analysis of variance (ANOVA) was conducted to examine the difference in the
average waste per company for the eight manufacturing waste groups. This was con-
ducted to examine if significant differences existed in the amount of waste these waste
TABLE 16.11 WASTE GROUP COMPARISON OF THE AVERAGE SOLID WASTE PER
COMPANY VERSUS THE REGRESSION COEFFICIENT FOR ISO 14001 CERTIFICATION
AVERAGE SOLID
WASTE PER ISO 14001
COMPANY PER REGRESSION
WASTE GROUP ABBREVIATION YEAR (TONS) COEFFICIENT T VALUE
Wood and lumber manufacturers WDM 1707.9 −217.6 −2.99
Metal manufacturers MLM 1313.6 −214.9 −2.52
Food manufacturers FDM 784.8 −183.5 −2.89
Chemical and rubber CHM 749.8 −140.4 −3.47
manufacturers
Paper manufacturers and PPM 726.0 −114.8 −2.48
publishers
Textile and fabric manufacturers FBM 584.7 −92.3 −2.36
Electronic manufacturers ELM 194.5 −56.3 −2.36
Transportation equipment TRM 653.5 −56.2 −4.51
manufacturers