Page 305 - Solid Waste Analysis and Minimization a Systems Approach
P. 305

ANALYSIS OF RESULTS AND SUMMARY OF FINDINGS            283


                         20
                     Regression coefficient for the number of employees  15


                         10


                          5


                          0
                             0           500          1000          1500          2000
                                  Average annual solid waste per company for the  20
                                                waste groups (tons)
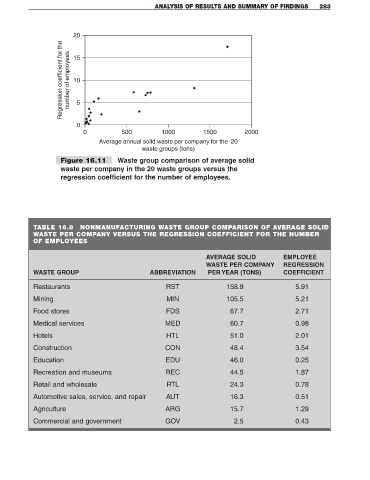
                     Figure 16.11       Waste group comparison of average solid
                     waste per company in the 20 waste groups versus the
                     regression coefficient for the number of employees.


            TABLE 16.8      NONMANUFACTURING WASTE GROUP COMPARISON OF AVERAGE SOLID
            WASTE PER COMPANY VERSUS THE REGRESSION COEFFICIENT FOR THE NUMBER
            OF EMPLOYEES

                                                                     AVERAGE SOLID             EMPLOYEE
                                                                     WASTE PER COMPANY         REGRESSION
            WASTE GROUP                            ABBREVIATION       PER YEAR (TONS)          COEFFICIENT

            Restaurants                                 RST                 158.9                  5.91
            Mining                                      MIN                 105.5                  5.21

            Food stores                                 FDS                  67.7                  2.71
            Medical services                            MED                  60.7                  0.98

            Hotels                                      HTL                  51.0                  2.01
            Construction                                CON                  48.4                  3.54

            Education                                   EDU                  46.0                  0.25
            Recreation and museums                      REC                  44.5                  1.87

            Retail and wholesale                        RTL                  24.3                  0.78
            Automotive sales, service, and repair       AUT                  16.3                  0.51

            Agriculture                                 ARG                  15.7                  1.29
            Commercial and government                   GOV                   2.5                  0.43
   300   301   302   303   304   305   306   307   308   309   310