
Page 297 - Solid Waste Analysis and Minimization a Systems Approach
P. 297
P Value 0.000 0.000 0.000 0.000 0.000 0.000 0.000 0.017 0.000 0.000 0.000 0.002 0.001 0.000 0.000 0.000 0.000 0.000 0.001 0.000
F Critical 4.75 4.23 3.49 3.92 4.35 5.59 3.86 5.79 5.32 5.99 4.67 4.76 7.71 3.71 4.67 4.75 4.04 3.86 3.71 3.71
F Statistic 41.38 122.06 21.10 749.43 71.48 31.50 33.52 12.35 29.84 22.39 47.11 18.86 17.00 16.35 42.55 53.71 2173.42 17.63 12.29 25.06
Adjusted R 2 0.80 0.76 0.83 0.86 0.78 0.81 0.72 0.85
R 2 0.79 0.83 0.84 0.86 0.79 0.84 0.78 0.90 0.81 0.82 0.80 0.90 0.85 0.83 0.78 0.83 0.81 0.85 0.79 0.88
Partial R 2 x 1 = 0.51 x 2 = 0.14 x 3 = 0.19 x 1 = 0.59 x 2 = 0.04 x 3 = 0.15 x 1 = 0.50 x 2 = 0.19 x 3 = 0.21 x 1 = 0.60 x 2 = 0.20 x 3 = 0.10 x 1 = 0.58 x 2 = 0.15 x 3 = 0.10 x 1 = 0.56 x 2 = 0.20 x 3 = 0.09 x 1 = 0.58 x 2 = 0.11 x 3 = 0.10 x 1 = 0.65 x 2 = 0.15 x 3 = 0.08
P Value x 1 = 0.000 x 2 = 0.011 x 3 = 0.005 x 1 = 0.000 x 2 = 0.033 x 3 = 0.000 x 1 = 0.011 x 2 = 0.046 x 3 = 0.044 x 1 = 0.003 x 2 = 0.022 x 3 = 0.045 x 1 = 0.001 x 2 = 0.024 x 3 = 0.033 x 1 = 0.000 x 2 = 0.008 x 3 = 0.042 x 1 = 0.000 x 2 = 0.029 x 3 = 0.040 x 1 = 0.000 x 2 = 0.004 x 3 = 0.014
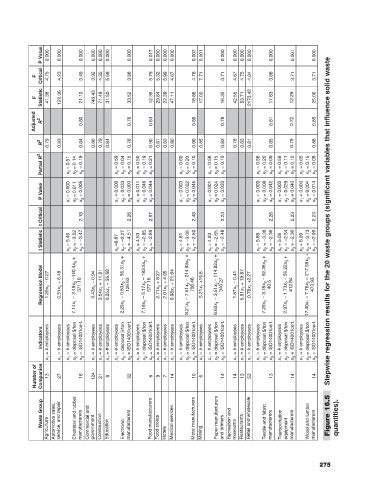
t Critical 2.18 2.26 2.57 2.48 2.23 2.26 2.23 2.23 Stepwise regression results for the 20 waste groups (significant variables that influence solid waste
t Statistic x 1 = 5.46 x 2 = –3.02 x 3 = –3.47 x 1 =8.67 x 2 = –2.27 x 3 = –4.51 x 1 = 4.53 x 2 = –2.85 x 3 = –2.89 x 1 = 4.81 x 2 = –3.08 x 3 = –2.52 x 1 = 4.83 x 2 = –2.65 x 3 = –2.48 x 1 = 5.88 x 2 = –3.38 x 3 = –2.36 x 1 = 5.06 x 2 = –2.54 x 3 = –2.36 x 1 = 6.99 x 2 = –3.73 x 3 = –2.99
Model
Regression 1.29x 1 – 0.27 0.51x 1 + 6.48 7.14x 1 – 3.49x 2 –140.4x 3 + 371.10 0.43x 1 – 0.94 3.54x 1 + 11.81 0.25x 1 + 35.68 2.29x 1 – 0.83x 2 – 56.31x 3 + 126.63 7.19x 1 – 5.17x 2 – 183.5x 3 + 577.16 2.71x 1 + 8.27 2.01x 1 + 4.05 0.98x 1 + 21.64 8.21x 1 – 7.51x 2 – 214.93x 3 + 756.46 5.21x 1 +19.8 6.63x 1 – 3.51x 2 – 114.82x 3 + 340.27 1.87x 1 – 0.41 5.91x 1 + 19.87 0.78x 1 +2.27 7.29x 1 – 3.78x 2 – 92.36x 3 + 40.
Indicators x 1 = # employees x 1 = # employees x 1 = # employees x 2 = disposal $/ton x 3 = ISO14001cert. x 1 = # employees x 1 = # employees x 1 = # employees x 1 = # employees x 2 = disposal $/ton x 3 = ISO14001cert. x 1 = # employees x 2 = disposal $/ton x 3 = ISO14001cert. x 1 = # employees x 1 = # employees x 1 = # employees x 1 = # employees x 2 = disposal $/ton x 3 = ISO14001cert. x 1 = # employees x 1 = # employee
Number of Companies 13 27 16 124 21 8 32 8 9 7 14 10 6 14 14 13 53 13 14 14
Waste Group Agriculture Automotive sales, service, and repair Chemical and rubber manufacturers Commercial and government Construction Education Electronic manufacturers Food manufacturers Food stores Hotels Medical services Metal manufacturers Mining Paper manufacturers and printers Recreation and museums Restaurants Retail and wholesale Textile and fabric manufacturers Transportation equipment manufacturers Wood and lumber manufactur
275