
Page 172 - Statistics II for Dummies
P. 172
156
Part III: Analyzing Variance with ANOVA
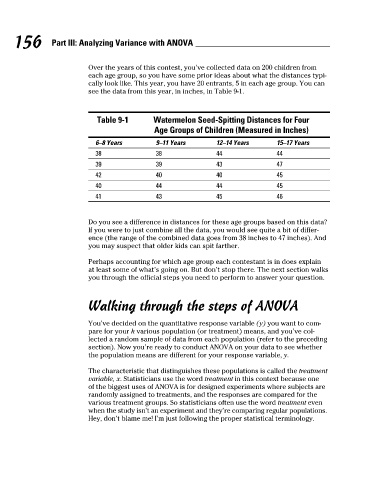
Over the years of this contest, you’ve collected data on 200 children from
each age group, so you have some prior ideas about what the distances typi-
cally look like. This year, you have 20 entrants, 5 in each age group. You can
see the data from this year, in inches, in Table 9-1.
Table 9-1 Watermelon Seed-Spitting Distances for Four
Age Groups of Children (Measured in Inches)
6–8 Years 9–11 Years 12–14 Years 15–17 Years
38 38 44 44
39 39 43 47
42 40 40 45
40 44 44 45
41 43 45 46
Do you see a difference in distances for these age groups based on this data?
If you were to just combine all the data, you would see quite a bit of differ-
ence (the range of the combined data goes from 38 inches to 47 inches). And
you may suspect that older kids can spit farther.
Perhaps accounting for which age group each contestant is in does explain
at least some of what’s going on. But don’t stop there. The next section walks
you through the official steps you need to perform to answer your question.
Walking through the steps of ANOVA
You’ve decided on the quantitative response variable (y) you want to com-
pare for your k various population (or treatment) means, and you’ve col-
lected a random sample of data from each population (refer to the preceding
section). Now you’re ready to conduct ANOVA on your data to see whether
the population means are different for your response variable, y.
The characteristic that distinguishes these populations is called the treatment
variable, x. Statisticians use the word treatment in this context because one
of the biggest uses of ANOVA is for designed experiments where subjects are
randomly assigned to treatments, and the responses are compared for the
various treatment groups. So statisticians often use the word treatment even
when the study isn’t an experiment and they’re comparing regular populations.
Hey, don’t blame me! I’m just following the proper statistical terminology.
7/23/09 9:31:28 PM
15_466469-ch09.indd 156
15_466469-ch09.indd 156 7/23/09 9:31:28 PM