
Page 177 - Statistics II for Dummies
P. 177
Chapter 9: Testing Lots of Means? Come On Over to ANOVA!
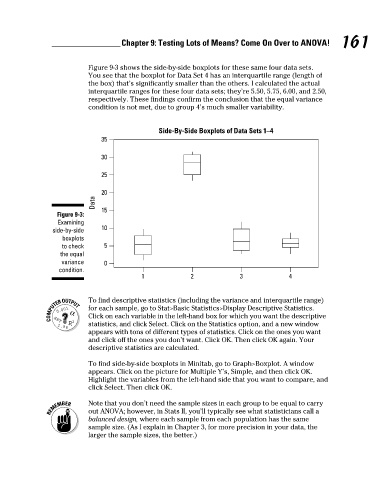
Figure 9-3 shows the side-by-side boxplots for these same four data sets. 161
You see that the boxplot for Data Set 4 has an interquartile range (length of
the box) that’s significantly smaller than the others. I calculated the actual
interquartile ranges for these four data sets; they’re 5.50, 5.75, 6.00, and 2.50,
respectively. These findings confirm the conclusion that the equal variance
condition is not met, due to group 4’s much smaller variability.
Side-By-Side Boxplots of Data Sets 1–4
35
30
25
20
Data
Figure 9-3: 15
Examining
side-by-side 10
boxplots
to check 5
the equal
variance 0
condition.
1 2 3 4
To find descriptive statistics (including the variance and interquartile range)
for each sample, go to Stat>Basic Statistics>Display Descriptive Statistics.
Click on each variable in the left-hand box for which you want the descriptive
statistics, and click Select. Click on the Statistics option, and a new window
appears with tons of different types of statistics. Click on the ones you want
and click off the ones you don’t want. Click OK. Then click OK again. Your
descriptive statistics are calculated.
To find side-by-side boxplots in Minitab, go to Graph>Boxplot. A window
appears. Click on the picture for Multiple Y’s, Simple, and then click OK.
Highlight the variables from the left-hand side that you want to compare, and
click Select. Then click OK.
Note that you don’t need the sample sizes in each group to be equal to carry
out ANOVA; however, in Stats II, you’ll typically see what statisticians call a
balanced design, where each sample from each population has the same
sample size. (As I explain in Chapter 3, for more precision in your data, the
larger the sample sizes, the better.)
7/23/09 9:31:29 PM
15_466469-ch09.indd 161 7/23/09 9:31:29 PM
15_466469-ch09.indd 161